Berkshire Hathaway 2007 Annual Report Download - page 53
Download and view the complete annual report
Please find page 53 of the 2007 Berkshire Hathaway annual report below. You can navigate through the pages in the report by either clicking on the pages listed below, or by using the keyword search tool below to find specific information within the annual report.-
 1
1 -
2
-
3
-
4
-
5
-
6
-
7
-
8
-
9
-
10
-
11
-
12
-
13
-
14
-
15
-
16
-
17
-
18
-
19
-
20
-
21
-
22
-
23
-
24
-
25
-
26
-
27
-
28
-
29
-
30
-
31
-
32
-
33
-
34
-
35
-
36
-
37
-
38
-
39
-
40
-
41
-
42
-
 43
43 -
 44
44 -
 45
45 -
 46
46 -
 47
47 -
 48
48 -
 49
49 -
 50
50 -
 51
51 -
 52
52 -
 53
53 -
 54
54 -
 55
55 -
 56
56 -
 57
57 -
 58
58 -
 59
59 -
 60
60 -
 61
61 -
 62
62 -
 63
63 -
64
-
65
-
66
-
67
-
68
-
69
-
70
-
71
-
72
-
73
-
74
-
75
-
76
-
77
-
78
 |
 |

52
Management’s Discussion (Continued)
Insurance — Underwriting (Continued)
A key marketing strategy followed by all of these businesses is the maintenance of extraordinary capital strength.
Statutory surplus of Berkshire’ s insurance businesses was approximately $62 billion at December 31, 2007. This superior capital
strength creates opportunities, especially with respect to reinsurance activities, to negotiate and enter into insurance and
reinsurance contracts specially designed to meet the unique needs of insurance and reinsurance buyers. Additional information
regarding Berkshire’ s insurance and reinsurance operations follows.
GEICO
GEICO provides primarily private passenger automobile coverages to insureds in 49 states and the District of
Columbia. GEICO policies are marketed mainly by direct response methods in which customers apply for coverage directly to
the company via the Internet, over the telephone or through the mail. This is a significant element in GEICO’ s strategy to be a
low-cost insurer. In addition, GEICO strives to provide excellent service to customers, with the goal of establishing long-term
customer relationships.
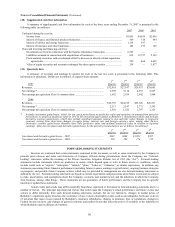
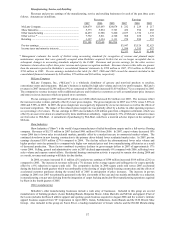
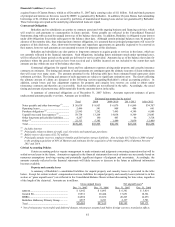
GEICO’ s underwriting results for the past three years are summarized below. Dollars are in millions.
2007 2006 2005
Amount %Amount %Amount %
Premiums written ............................................................... $11,931 $11,303 $10,285
Premiums earned................................................................ $11,806 100.0 $11,055 100.0 $10,101 100.0
Losses and loss adjustment expenses ................................. 8,523 72.2 7,749 70.1 7,128 70.6
Underwriting expenses....................................................... 2,170 18.4 1,992 18.0 1,752 17.3
Total losses and expenses................................................... 10,693 90.6 9,741 88.1 8,880 87.9
Pre-tax underwriting gain................................................... $ 1,113 $ 1,314 $ 1,221*
* Net of losses of $200 million from Hurricanes Katrina, Rita and Wilma.
Premiums earned in 2007 and 2006 increased 6.8% and 9.4%, respectively, over the corresponding prior year amounts.
The growth in premiums earned for voluntary auto in 2007 was 6.6%, which was less than the 8.8% increase in policies-in-force
during the past year as average premiums per policy continue to slowly decline. Average premiums per policy in 2008 are
expected to be relatively unchanged from 2007. Policies-in-force also increased over the last twelve months in the preferred risk
markets (8.4%) and in the standard and nonstandard markets (10.0%). Voluntary auto new business sales increased 5.0% in
2007 as compared to the prior year. Voluntary auto policies-in-force at December 31, 2007 were 656,000 higher than at
December 31, 2006.
Losses and loss adjustment expenses in 2007 were $8,523 million, an increase of 10.0% over 2006. The loss ratio
increased to 72.2% in 2007 compared to 70.1% in 2006 and 70.6% in 2005. The increase in the loss ratio in 2007 in part reflects
the aforementioned decline in average premiums per policy attributable to rate decreases. In 2007, claims frequencies for
physical damage coverages increased in the two to four percent range over 2006 while frequencies for injury coverages
decreased in the three to five percent range. Physical damage severities increased in the second half of 2007 at an annualized rate
of two to four percent. Injury severities also began to increase in the latter part of 2007 at an annualized rate of three to six percent.
Incurred losses from catastrophe events were approximately $34 million in 2007, $54 million in 2006 and $227 million in 2005
(primarily from the hurricanes in the third and fourth quarters).
Underwriting expenses in 2007 were $2,170 million, an increase of 8.9% over 2006, which increased 13.7% over 2005.
The increases in expenses in both years primarily reflected higher advertising costs as well as increased personnel costs to
service the growth of policies-in-force.
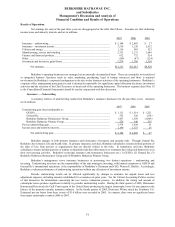
General Re
General Re conducts a reinsurance business offering property and casualty and life and health coverages to clients
worldwide. Property and casualty reinsurance is written in North America on a direct basis through General Reinsurance
Corporation and internationally through 95% owned Cologne Re (based in Germany) and other wholly-owned affiliates.
Property and casualty reinsurance is also written through brokers with respect to Faraday in London. Life and health reinsurance
is written worldwide through Cologne Re. General Re strives to generate underwriting gains in essentially all of its product
lines. Underwriting performance is not evaluated based upon market share and underwriters are instructed to reject inadequately
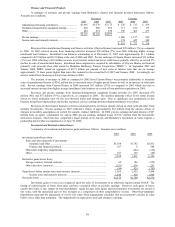
priced risks. General Re’ s underwriting results are summarized for the past three years in the following table. Amounts are in
millions.
Pre-tax underwriting
Premiums written Premiums earned gain (loss)
2007 2006 2005 2007 2006 2005 2007 2006 2005
Property/casualty............. $3,478 $3,581 $3,852 $3,614 $3,711 $4,140 $ 475 $ 373 $ (445)*
Life/health ....................... 2,479 2,368 2,303 2,462 2,364 2,295 80 153 111
$5,957 $5,949 $6,155 $6,076 $6,075 $6,435 $ 555 $ 526 $ (334)
* Includes losses of $685 million from Hurricanes Katrina, Rita and Wilma.