Berkshire Hathaway 2007 Annual Report Download - page 27
Download and view the complete annual report
Please find page 27 of the 2007 Berkshire Hathaway annual report below. You can navigate through the pages in the report by either clicking on the pages listed below, or by using the keyword search tool below to find specific information within the annual report.-
 1
1 -
2
-
3
-
4
-
5
-
6
-
7
-
8
-
9
-
10
-
11
-
12
-
13
-
14
-
15
-
16
-
 17
17 -
 18
18 -
 19
19 -
 20
20 -
 21
21 -
 22
22 -
 23
23 -
 24
24 -
 25
25 -
 26
26 -
 27
27 -
 28
28 -
 29
29 -
 30
30 -
 31
31 -
 32
32 -
 33
33 -
 34
34 -
 35
35 -
 36
36 -
 37
37 -
38
-
39
-
40
-
41
-
42
-
43
-
44
-
45
-
46
-
47
-
48
-
49
-
50
-
51
-
52
-
53
-
54
-
55
-
56
-
57
-
58
-
59
-
60
-
61
-
62
-
63
-
64
-
65
-
66
-
67
-
68
-
69
-
70
-
71
-
72
-
73
-
74
-
75
-
76
-
77
-
78
 |
 |

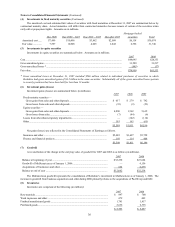
26
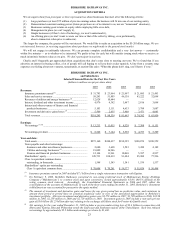
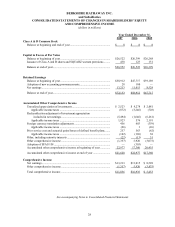
BERKSHIRE HATHAWAY INC.
and Subsidiaries
CONSOLIDATED STATEMENTS OF EARNINGS
(dollars in millions except per share amounts)
Year Ended December 31,
2007 2006 2005
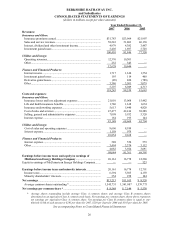
Revenues:
Insurance and Other:
Insurance premiums earned.............................................................. $31,783 $23,964 $21,997
Sales and service revenues ............................................................... 58,243 51,803 46,138
Interest, dividend and other investment income ............................... 4,979 4,382 3,487
Investment gains/losses .................................................................... 5,405 1,697 5,728
100,410 81,846 77,350
Utilities and Energy:
Operating revenues........................................................................... 12,376 10,301 —
Other................................................................................................. 252 343 —
12,628 10,644 —
Finance and Financial Products:
Interest income ................................................................................. 1,717 1,610 1,554
Investment gains/losses .................................................................... 193 114 468
Derivative gains/losses ..................................................................... (89) 824 (788)
Other................................................................................................. 3,386 3,501 3,079
5,207 6,049 4,313
118,245 98,539 81,663
Costs and expenses:
Insurance and Other:
Insurance losses and loss adjustment expenses ................................ 21,010 13,068 15,482
Life and health insurance benefits.................................................... 1,786 1,618 1,634
Insurance underwriting expenses...................................................... 5,613 5,440 4,828
Cost of sales and services................................................................. 47,477 42,416 38,288
Selling, general and administrative expenses ................................... 7,098 5,932 5,328
Interest expense ................................................................................ 164 195 144
83,148 68,669 65,704
Utilities and Energy:
Cost of sales and operating expenses ............................................... 9,696 8,189 —
Interest expense................................................................................ 1,158 979 —
10,854 9,168 —
Finance and Financial Products:
Interest expense................................................................................ 588 550 579
Other................................................................................................. 3,494 3,374 3,112
4,082 3,924 3,691
98,084 81,761 69,395
Earnin
g
s before income taxes and e
q
uit
y
in earnin
g
s of
MidAmerican Energy Holdings Company................................... 20,161 16,778 12,268
Equity in earnings of MidAmerican Energy Holdings Company........ — — 523
Earnings before income taxes and minority interests .................... 20,161 16,778 12,791
Income taxes..................................................................................... 6,594 5,505 4,159
Minority shareholders’ interests ....................................................... 354 258 104
Net earnings ....................................................................................... $13,213 $11,015 $ 8,528
Average common shares outstanding * ............................................ 1,545,751 1,541,807 1,539,775
Net earnings per common share *.................................................... $ 8,548 $ 7,144 $ 5,538
* Average shares outstanding include average Class A common shares and average Class B common shares
determined on an equivalent Class A common stock basis. Net earnings per common share shown above represents
net earnings per equivalent Class A common share. Net earnings per Class B common share is equal to one-
thirtieth (1/30) of such amount or $285 per share for 2007, $238 per share for 2006 and $185 per share for 2005.
See accompanying Notes to Consolidated Financial Statements