Berkshire Hathaway 2007 Annual Report Download - page 51
Download and view the complete annual report
Please find page 51 of the 2007 Berkshire Hathaway annual report below. You can navigate through the pages in the report by either clicking on the pages listed below, or by using the keyword search tool below to find specific information within the annual report.-
 1
1 -
2
-
3
-
4
-
5
-
6
-
7
-
8
-
9
-
10
-
11
-
12
-
13
-
14
-
15
-
16
-
17
-
18
-
19
-
20
-
21
-
22
-
23
-
24
-
25
-
26
-
27
-
28
-
29
-
30
-
31
-
32
-
33
-
34
-
35
-
36
-
37
-
38
-
39
-
40
-
 41
41 -
 42
42 -
 43
43 -
 44
44 -
 45
45 -
 46
46 -
 47
47 -
 48
48 -
 49
49 -
 50
50 -
 51
51 -
 52
52 -
 53
53 -
 54
54 -
 55
55 -
 56
56 -
 57
57 -
 58
58 -
 59
59 -
 60
60 -
 61
61 -
62
-
63
-
64
-
65
-
66
-
67
-
68
-
69
-
70
-
71
-
72
-
73
-
74
-
75
-
76
-
77
-
78
 |
 |

50
Notes to Consolidated Financial Statements (Continued)
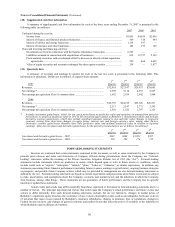
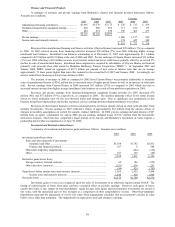
(20) Supplemental cash flow information
A summary of supplemental cash flow information for each of the three years ending December 31, 2007 is presented in the
following table (in millions).
2007 2006 2005
Cash paid during the year for:
Income taxes............................................................................................................................. $5,895 $4,959 $2,695
Interest of finance and financial products businesses................................................................ 569 514 484
Interest of utilities and energy businesses................................................................................. 1,118 937 —
Interest of insurance and other businesses ................................................................................ 182 195 149
Non-cash investing and financing activities:
Investments received in connection with the Equitas reinsurance transaction .......................... 6,529 — —
Liabilities assumed in connection with acquisitions of businesses ........................................... 612 12,727 2,163
Fixed maturity securities sold or redeemed offset by decrease in directly related repurchase
agreements ......................................................................................................................... 599 460 4,693
Value of equity securities and warrants exchanged for other equity securities ......................... 258 — 5,877
(21) Quarterly data
A summary of revenues and earnings by quarter for each of the last two years is presented in the following table. This
information is unaudited. Dollars are in millions, except per share amounts.
1
s
t2n
d
3
r
d
4
t
h
2007 Quarter Quarter Quarter Quarter
Revenues.............................................................................................................. $32,918 $27,347 $29,937 $28,043
N
et earnings *...................................................................................................... 2,595 3,118 4,553 2,947
Net earnings per equivalent Class A common share............................................ 1,682 2,018 2,942 1,904
2006
Revenues.............................................................................................................. $22,763 $24,185 $25,360 $26,231
N
et earnings *...................................................................................................... 2,313 2,347 2,772 3,583
N
et earnings per equivalent Class A common share............................................ 1,501 1,522 1,797 2,323
* Includes investment gains/losses, which, for any given period have no predictive value and variations in amount from period to
period have no practical analytical value in view of the unrealized appreciation in Berkshire’s investment portfolio and includes
derivative contract gains/losses, which may include significant amounts related to non-cash fair value changes to long-term
contracts arising from short-term changes in equity prices, interest rate and foreign currency rates, among other factors.
Derivative contract gains/losses therefore have little predictive value and minimal analytical value in relation to reported
earnings. After-tax investment and derivative gains/losses for the periods presented above are as follows (in millions):
1
s
t
2
n
d
3
r
d
4
t
h
Quarter Quarter Quarter Quarter
I
nvestment and derivative gains/losses – 2007.................................................... $382 $608 $1,992 $597
I
nvestment and derivative gains/losses – 2006.................................................... 526 294 174 715
FORWARD-LOOKING STATEMENTS
Investors are cautioned that certain statements contained in this document, as well as some statements by the Company in
periodic press releases and some oral statements of Company officials during presentations about the Company, are “forward-
looking” statements within the meaning of the Private Securities Litigation Reform Act of 1995 (the “Act”). Forward-looking
statements include statements which are predictive in nature, which depend upon or refer to future events or conditions, which
include words such as “expects,” “anticipates,” “intends,” “plans,” “believes,” “estimates,” or similar expressions. In addition, any
statements concerning future financial performance (including future revenues, earnings or growth rates), ongoing business strategies
or prospects, and possible future Company actions, which may be provided by management are also forward-looking statements as
defined by the Act. Forward-looking statements are based on current expectations and projections about future events and are subject
to risks, uncertainties, and assumptions about the Company, economic and market factors and the industries in which the Company
does business, among other things. These statements are not guaranties of future performance and the Company has no specific
intention to update these statements.
Actual events and results may differ materially from those expressed or forecasted in forward-looking statements due to a
number of factors. The principal important risk factors that could cause the Company’ s actual performance and future events and
actions to differ materially from such forward-looking statements, include, but are not limited to, changes in market prices of
Berkshire’ s significant equity investees, the occurrence of one or more catastrophic events, such as an earthquake, hurricane or an act
of terrorism that causes losses insured by Berkshire’ s insurance subsidiaries, changes in insurance laws or regulations, changes in
Federal income tax laws, and changes in general economic and market factors that affect the prices of securities or the industries in
which Berkshire and its affiliates do business.