Berkshire Hathaway 2007 Annual Report Download - page 46
Download and view the complete annual report
Please find page 46 of the 2007 Berkshire Hathaway annual report below. You can navigate through the pages in the report by either clicking on the pages listed below, or by using the keyword search tool below to find specific information within the annual report.-
 1
1 -
2
-
3
-
4
-
5
-
6
-
7
-
8
-
9
-
10
-
11
-
12
-
13
-
14
-
15
-
16
-
17
-
18
-
19
-
20
-
21
-
22
-
23
-
24
-
25
-
26
-
27
-
28
-
29
-
30
-
31
-
32
-
33
-
34
-
35
-
 36
36 -
 37
37 -
 38
38 -
 39
39 -
 40
40 -
 41
41 -
 42
42 -
 43
43 -
 44
44 -
 45
45 -
 46
46 -
 47
47 -
 48
48 -
 49
49 -
 50
50 -
 51
51 -
 52
52 -
 53
53 -
 54
54 -
 55
55 -
 56
56 -
57
-
58
-
59
-
60
-
61
-
62
-
63
-
64
-
65
-
66
-
67
-
68
-
69
-
70
-
71
-
72
-
73
-
74
-
75
-
76
-
77
-
78
 |
 |

45
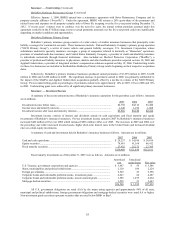
(18) Business segment data (Continued)
Other businesses not specifically identified with reportable business segments consist of a large, diverse group of
manufacturing, service and retailing businesses.
Manufacturing Acme Building Brands, Benjamin Moore, H.H. Brown Shoe
Group, CTB, Fechheimer Brothers, Forest River, Fruit of the
Loom, Garan, IMC, Johns Manville, Justin Brands, Larson-Juhl,
MiTek, Richline, Russell and Scott Fetzer
Service Buffalo News, Business Wire, FlightSafety, International Dairy
Queen, Pampered Chef, NetJets and TTI
Retailing Ben Bridge Jeweler, Borsheims, Helzberg Diamond Shops,
Jordan’ s Furniture, Nebraska Furniture Mart, See’ s, Star Furniture
and R.C. Willey
A disaggregation of Berkshire’ s consolidated data for each of the three most recent years is presented in the tables which
follow on this and the following page. Amounts are in millions.
Earnings (loss) before taxes
Operating Businesses: Revenues and minority interests
Insurance group: 2007 2006 2005 2007 2006 2005
Premiums earned:
GEICO ..................................................................... $ 11,806 $11,055 $10,101 $ 1,113 $ 1,314 $ 1,221
General Re ............................................................... 6,076 6,075 6,435 555 526 (334)
Berkshire Hathaway Reinsurance Group ................. 11,902 4,976 3,963 1,427 1,658 (1,069)
Berkshire Hathaway Primary Group........................ 1,999 1,858 1,498 279 340 235
Investment income ...................................................... 4,791 4,347 3,501 4,758 4,316 3,480
Total insurance group..................................................... 36,574 28,311 25,498 8,132 8,154 3,533
Finance and financial products....................................... 5,119 5,124 4,559 1,006 1,157 822
McLane Company.......................................................... 28,079 25,693 24,074 232 229 217
MidAmerican ................................................................. 12,628 10,644 — 1,774 1,476 —
Shaw Industries .............................................................. 5,373 5,834 5,723 436 594 485
Other businesses............................................................. 25,648 21,133 17,099 3,279 2,703 1,921
113,421 96,739 76,953 14,859 14,313 6,978
Reconciliation of segments to consolidated amount:
Investment and derivative gains/losses ....................... 5,509 2,635 5,494 5,509 2,635 5,494
Equity in earnings of MidAmerican............................ — — — — — 523
Interest expense, not allocated to segments................. — — — (52) (76) (72)
Eliminations and other ................................................ (685) (835) (784) (155) (94) (132)
$118,245 $98,539 $81,663 $20,161 $16,778 $12,791
Depreciation
Capital expenditures * of tangible assets
Operating Businesses: 2007 2006 2005 2007 2006 2005
Insurance group.............................................................. $ 52 $ 65 $ 60 $ 69 $ 64 $ 62
Finance and financial products....................................... 322 334 354 226 230 221
McLane Company.......................................................... 175 193 125 100 94 96
MidAmerican ................................................................. 3,513 2,423 — 1,157 949 —
Shaw Industries.............................................................. 144 189 209 144 134 113
Other businesses............................................................. 1,167 1,367 1,447 711 595 490
$ 5,373 $ 4,571 $ 2,195 $ 2,407 $ 2,066 $ 982
* Excludes capital expenditures which were part of business acquisitions.