Berkshire Hathaway 2007 Annual Report Download - page 37
Download and view the complete annual report
Please find page 37 of the 2007 Berkshire Hathaway annual report below. You can navigate through the pages in the report by either clicking on the pages listed below, or by using the keyword search tool below to find specific information within the annual report.-
 1
1 -
2
-
3
-
4
-
5
-
6
-
7
-
8
-
9
-
10
-
11
-
12
-
13
-
14
-
15
-
16
-
17
-
18
-
19
-
20
-
21
-
22
-
23
-
24
-
25
-
26
-
 27
27 -
 28
28 -
 29
29 -
 30
30 -
 31
31 -
 32
32 -
 33
33 -
 34
34 -
 35
35 -
 36
36 -
 37
37 -
 38
38 -
 39
39 -
 40
40 -
 41
41 -
 42
42 -
 43
43 -
 44
44 -
 45
45 -
 46
46 -
 47
47 -
48
-
49
-
50
-
51
-
52
-
53
-
54
-
55
-
56
-
57
-
58
-
59
-
60
-
61
-
62
-
63
-
64
-
65
-
66
-
67
-
68
-
69
-
70
-
71
-
72
-
73
-
74
-
75
-
76
-
77
-
78
 |
 |

36
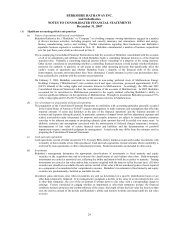
Notes to Consolidated Financial Statements (Continued)
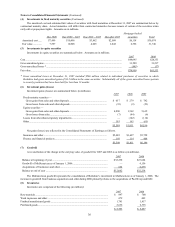
(4) Investments in fixed maturity securities (Continued)
The amortized cost and estimated fair values of securities with fixed maturities at December 31, 2007 are summarized below by
contractual maturity dates. Actual maturities will differ from contractual maturities because issuers of certain of the securities retain
early call or prepayment rights. Amounts are in millions.
Mortgage-backed
Due 2008 Due 2009 – 2012 Due 2013 – 2017 Due after 2017 securities Total
Amortized cost ...... $7,499 $10,496 $3,862 $2,099 $6,118 $30,074
Fair value............... 7,597 10,908 4,003 2,842 6,396 31,746
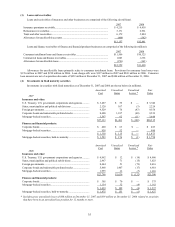
(5) Investments in equity securities
Investments in equity securities are summarized below. Amounts are in millions.
2007 2006
Cost............................................................................................................................................................ $44,695 $28,353
Gross unrealized gains .............................................................................................................................. 31,289 33,217
Gross unrealized losses * .......................................................................................................................... (985) (37)
Fair value................................................................................................................................................... $74,999 $61,533
* Gross unrealized losses at December 31, 2007 included $566 million related to individual purchases of securities in which
Berkshire had gross unrealized gains of $3.2 billion in the same securities. Substantially all of the gross unrealized losses pertain
to security positions that have been held for less than 12 months.
(6) Investment gains (losses)
Investment gains (losses) are summarized below (in millions).
2007 2006 2005
Fixed maturity securities —
Gross gains from sales and other disposals ........................................................... $ 657 $ 279 $ 792
Gross losses from sales and other disposals.......................................................... (35) (9) (23)
Equity securities —
Gross gains from sales and other disposals ........................................................... 4,880 1,562 5,612
Gross losses from sales.......................................................................................... (7) (44) (6)
Losses from other-than-temporary impairments ....................................................... — (142) (114)
Other.......................................................................................................................... 103 165 (65)
$5,598 $1,811 $6,196
Net gains (losses) are reflected in the Consolidated Statements of Earnings as follows.
Insurance and other ................................................................................................... $5,405 $1,697 $5,728
Finance and financial products.................................................................................. 193 114 468
$5,598 $1,811 $6,196
(7) Goodwill
A reconciliation of the change in the carrying value of goodwill for 2007 and 2006 is as follows (in millions).
2007 2006
Balance at beginning of year ..................................................................................... $32,238 $23,644
Goodwill of MidAmerican as of January 1, 2006...................................................... — 4,156
Acquisitions of businesses and other......................................................................... 624 4,438
Balance at end of year ............................................................................................... $32,862 $32,238
The MidAmerican goodwill represents the consolidation of Berkshire’ s investment in MidAmerican as of January 1, 2006. The
increase in goodwill from business acquisitions and other during 2006 primarily relates to the acquisitions of PacifiCorp and IMC.
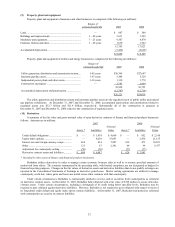
(8) Inventories
Inventories are comprised of the following (in millions):
2007 2006
Raw materials...................................................................................................................... $ 897 $ 700
Work in process and other .................................................................................................. 479 402
Finished manufactured goods ............................................................................................. 1,781 1,817
Purchased goods.................................................................................................................. 2,636 2,338
$ 5,793 $ 5,257