Berkshire Hathaway 2007 Annual Report Download - page 24
Download and view the complete annual report
Please find page 24 of the 2007 Berkshire Hathaway annual report below. You can navigate through the pages in the report by either clicking on the pages listed below, or by using the keyword search tool below to find specific information within the annual report.-
 1
1 -
2
-
3
-
4
-
5
-
6
-
7
-
8
-
9
-
10
-
11
-
12
-
13
-
 14
14 -
 15
15 -
 16
16 -
 17
17 -
 18
18 -
 19
19 -
 20
20 -
 21
21 -
 22
22 -
 23
23 -
 24
24 -
 25
25 -
 26
26 -
 27
27 -
 28
28 -
 29
29 -
 30
30 -
 31
31 -
 32
32 -
 33
33 -
 34
34 -
35
-
36
-
37
-
38
-
39
-
40
-
41
-
42
-
43
-
44
-
45
-
46
-
47
-
48
-
49
-
50
-
51
-
52
-
53
-
54
-
55
-
56
-
57
-
58
-
59
-
60
-
61
-
62
-
63
-
64
-
65
-
66
-
67
-
68
-
69
-
70
-
71
-
72
-
73
-
74
-
75
-
76
-
77
-
78
 |
 |

23
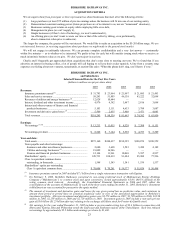
BERKSHIRE HATHAWAY INC.
ACQUISITION CRITERIA
We are eager to hear from principals or their representatives about businesses that meet all of the following criteria:
(1) Large purchases (at least $75 million of pre-tax earnings unless the business will fit into one of our existing units),
(2) Demonstrated consistent earning power (future projections are of no interest to us, nor are “turnaround” situations),
(3) Businesses earning good returns on equity while employing little or no debt,
(4) Management in place (we can’ t supply it),
(5) Simple businesses (if there’ s lots of technology, we won’ t understand it),
(6) An offering price (we don’ t want to waste our time or that of the seller by talking, even preliminarily,
about a transaction when price is unknown).
The larger the company, the greater will be our interest: We would like to make an acquisition in the $5-20 billion range. We are
not interested, however, in receiving suggestions about purchases we might make in the general stock market.
We will not engage in unfriendly takeovers. We can promise complete confidentiality and a very fast answer — customarily
within five minutes — as to whether we’ re interested. We prefer to buy for cash, but will consider issuing stock when we receive as
much in intrinsic business value as we give. We don’t participate in auctions.
Charlie and I frequently get approached about acquisitions that don’ t come close to meeting our tests: We’ ve found that if you
advertise an interest in buying collies, a lot of people will call hoping to sell you their cocker spaniels. A line from a country song
expresses our feeling about new ventures, turnarounds, or auction-like sales: “When the phone don’ t ring, you’ ll know it’ s me.”
BERKSHIRE HATHAWAY INC.
and Subsidiaries
Selected Financial Data for the Past Five Years
(dollars in millions except per share data)
2007 2006 2005 2004 2003
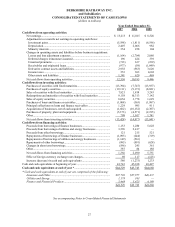
Revenues:
Insurance premiums earned (1) ................................................ $ 31,783 $ 23,964 $ 21,997 $ 21,085 $ 21,493
Sales and service revenues ..................................................... 58,243 51,803 46,138 43,222 32,098
Revenues of utilities and energy businesses (2) ....................... 12,628 10,644 — — —
Interest, dividend and other investment income ..................... 4,979 4,382 3,487 2,816 3,098
Interest and other revenues of finance and financial
products businesses .............................................................
5,103
5,111
4,633
3,788
3,087
Investment and derivative gains/losses (3)............................... 5,509 2,635 5,408 3,471 4,083
Total revenues ........................................................................ $118,245 $ 98,539 $ 81,663 $ 74,382 $ 63,859
Earnings:
Net earnings (3) (4).................................................................... $ 13,213 $ 11,015 $ 8,528 $ 7,308 $ 8,151
Net earnings per share ............................................................ $ 8,548 $ 7,144 $ 5,538 $ 4,753 $ 5,309
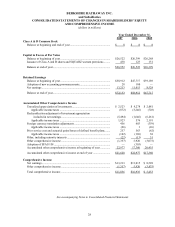
Year-end data:
Total assets ............................................................................. $273,160 $248,437 $198,325 $188,874 $180,559
Notes payable and other borrowings:
Insurance and other non-finance businesses........................ 2,680 3,698 3,583 3,450 4,182
Utilities and energy businesses (2) ....................................... 19,002 16,946 — — —
Finance and financial products businesses.......................... 12,144 11,961 10,868 5,387 4,937
Shareholders’ equity............................................................... 120,733 108,419 91,484 85,900 77,596
Class A equivalent common shares
outstanding, in thousands .................................................... 1,548 1,543 1,541 1,539 1,537
Shareholders’ equity per outstanding
Class A equivalent common share ...................................... $ 78,008 $ 70,281 $ 59,377 $ 55,824 $ 50,498
(1) Insurance premiums earned in 2007 included $7.1 billion from a single reinsurance transaction with Equitas.
(2) On February 9, 2006, Berkshire Hathaway converted its non-voting preferred stock of MidAmerican Energy Holdings
Company (“MidAmerican”) to common stock and upon conversion, owned approximately 83.4% (80.5% diluted) of the
voting common stock interests. Accordingly, the Consolidated Financial Statements in 2006 and 2007 reflect the
consolidation of the accounts of MidAmerican. In each of the three years ending December 31, 2005, Berkshire’s investment
in MidAmerican was accounted for pursuant to the equity method.
(3) The amount of investment and derivative gains and losses for any given period has no predictive value, and variations in
amount from period to period have no practical analytical value in view of the unrealized appreciation in Berkshire's
investment portfolio. After-tax investment and derivative gains were $3,579 million in 2007, $1,709 million in 2006, $3,530
million in 2005, $2,259 million in 2004 and $2,729 million in 2003. Investment gains in 2005 include a non-cash pre-tax
gain of $5.0 billion ($3.25 billion after-tax) relating to the exchange of Gillette stock for Procter & Gamble stock.
(4) Net earnings for the year ended December 31, 2005 includes a pre-tax underwriting loss of $3.4 billion in connection with
Hurricanes Katrina, Rita and Wilma that struck the Gulf coast and Southeast regions of the United States. Such loss reduced
net earnings by approximately $2.2 billion and earnings per share by $1,446.