Berkshire Hathaway 2000 Annual Report Download - page 73
Download and view the complete annual report
Please find page 73 of the 2000 Berkshire Hathaway annual report below. You can navigate through the pages in the report by either clicking on the pages listed below, or by using the keyword search tool below to find specific information within the annual report.-
 1
1 -
2
-
3
-
4
-
5
-
6
-
7
-
8
-
9
-
10
-
11
-
12
-
13
-
14
-
15
-
16
-
17
-
18
-
19
-
20
-
21
-
22
-
23
-
24
-
25
-
26
-
27
-
28
-
29
-
30
-
31
-
32
-
33
-
34
-
35
-
36
-
37
-
38
-
39
-
40
-
41
-
42
-
43
-
44
-
45
-
46
-
47
-
48
-
49
-
50
-
51
-
52
-
53
-
54
-
55
-
56
-
57
-
58
-
59
-
60
-
61
-
62
-
 63
63 -
 64
64 -
 65
65 -
 66
66 -
 67
67 -
 68
68 -
 69
69 -
 70
70 -
 71
71 -
 72
72 -
 73
73 -
 74
74 -
 75
75 -
 76
76 -
 77
77 -
 78
78
 |
 |

72
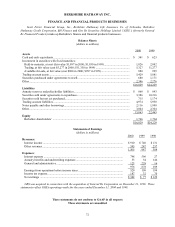
BERKSHIRE HATHAWAY INC.
FINANCE AND FINANCIAL PRODUCTS BUSINESSES
Scott Fetzer Financial Group, Inc., Berkshire Hathaway Life Insurance Co. of Nebraska, Berkshire
Hathaway Credit Corporation, BH Finance and Gen Re Securities Holdings Limited (“GRS”) (formerly General
Re Financial Products) make up Berkshire's finance and financial products businesses.
Balance Sheets
(dollars in millions)
2000 1999
Assets
Cash and cash equivalents ..................................................................................................... $ 341 $ 623
Investment in securities with fixed maturities:
Held-to-maturity, at cost (fair value $1,897 in 2000; $1,930 in 1999).................................. 1,826 2,002
Trading, at fair value (cost $5,277 in 2000; $11,330 in 1999) ............................................. 5,327 11,277
Available-for-sale, at fair value (cost $880 in 2000; $997 in 1999)...................................... 880 999
Trading account assets........................................................................................................... 5,429 5,881
Securities purchased under agreements to resell..................................................................... 680 1,171
Other ..................................................................................................................................... 2,346 2,276
$16,829 $24,229
Liabilities
Annuity reserves and policyholder liabilities.......................................................................... $ 868 $ 843
Securities sold under agreements to repurchase...................................................................... 3,386 10,216
Securities sold but not yet purchased...................................................................................... 715 1,174
Trading account liabilities ..................................................................................................... 4,974 5,930
Notes payable and other borrowings....................................................................................... 2,116 1,998
Other ..................................................................................................................................... 3,004 2,304
15,063 22,465
Equity
Berkshire shareholders’ ...................................................................................................... 1,766 1,764
$16,829 $24,229
Statements of Earnings
(dollars in millions)
2000 1999 1998
Revenues:
Interest income .......................................................................................................... $ 910 $ 740 $ 131
Other revenues........................................................................................................... 595 247 257
1,505 987 388
Expenses:
Interest expense ......................................................................................................... 798 596 27
Annuity benefits and underwriting expenses .............................................................. 55 54 146
General and administrative ........................................................................................ 123 228 16
976 878 189
Earnings from operations before income taxes ........................................................... 529 109 199
Income tax expense.................................................................................................... 187 32 70
Net earnings .............................................................................................................. $ 342 $ 77 $ 129
GRS was acquired in connection with the acquisition of General Re Corporation on December 21, 1998. These
statements reflect GRS’s operating results for the years ended December 31, 2000 and 1999.
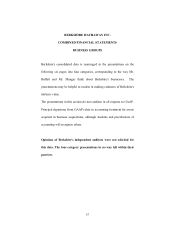
These statements do not conform to GAAP in all respects
These statements are unaudited