Berkshire Hathaway 2000 Annual Report Download - page 26
Download and view the complete annual report
Please find page 26 of the 2000 Berkshire Hathaway annual report below. You can navigate through the pages in the report by either clicking on the pages listed below, or by using the keyword search tool below to find specific information within the annual report.-
 1
1 -
2
-
3
-
4
-
5
-
6
-
7
-
8
-
9
-
10
-
11
-
12
-
13
-
14
-
15
-
 16
16 -
 17
17 -
 18
18 -
 19
19 -
 20
20 -
 21
21 -
 22
22 -
 23
23 -
 24
24 -
 25
25 -
 26
26 -
 27
27 -
 28
28 -
 29
29 -
 30
30 -
 31
31 -
 32
32 -
 33
33 -
 34
34 -
 35
35 -
 36
36 -
37
-
38
-
39
-
40
-
41
-
42
-
43
-
44
-
45
-
46
-
47
-
48
-
49
-
50
-
51
-
52
-
53
-
54
-
55
-
56
-
57
-
58
-
59
-
60
-
61
-
62
-
63
-
64
-
65
-
66
-
67
-
68
-
69
-
70
-
71
-
72
-
73
-
74
-
75
-
76
-
77
-
78
 |
 |

25
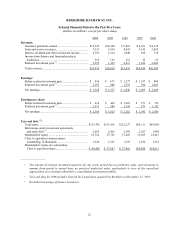
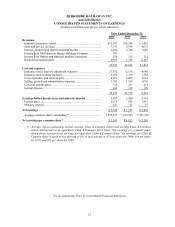
BERKSHIRE HATHAWAY INC.
and Subsidiaries
CONSOLIDATED STATEMENTS OF EARNINGS
(dollars in millions except per share amounts)
Year Ended December 31,
2000 1999 1998
Revenues:
Insurance premiums earned ........................................................... $19,343 $14,306 $ 5,481
Sales and service revenues............................................................. 7,331 5,918 4,675
Interest, dividend and other investment income.............................. 2,686 2,314 1,049
Income from MidAmerican Energy Holdings Company................. 105 — —
Income from finance and financial products businesses.................. 556 125 212
Realized investment gain............................................................... 3,955 1,365 2,415
33,976 24,028 13,832
Cost and expenses:
Insurance losses and loss adjustment expenses............................... 17,332 12,518 4,040
Insurance underwriting expenses ................................................... 3,602 3,220 1,184
Cost of products and services sold ................................................. 4,893 4,065 3,018
Selling, general and administrative expenses.................................. 1,703 1,164 1,056
Goodwill amortization................................................................... 715 477 111
Interest expense............................................................................. 144 134 109
28,389 21,578 9,518
Earnings before income taxes and minority interest..................... 5,587 2,450 4,314
Income taxes ................................................................................. 2,018 852 1,457
Minority interest ........................................................................... 241 41 27
Net earnings ................................................................................... $ 3,328 $ 1,557 $ 2,830
Average common shares outstanding * .......................................... 1,522,933 1,519,703 1,251,363
Net earnings per common share * ................................................. $ 2,185 $ 1,025 $ 2,262
* Average shares outstanding include average Class A Common shares and average Class B Common
shares determined on an equivalent Class A Common Stock basis. Net earnings per common share
shown above represents net earnings per equivalent Class A Common share. Net earnings per Class B
Common share is equal to one-thirtieth (1/30) of such amount or $73 per share for 2000, $34 per share
for 1999, and $75 per share for 1998.
See accompanying Notes to Consolidated Financial Statements