Berkshire Hathaway 2000 Annual Report Download - page 35
Download and view the complete annual report
Please find page 35 of the 2000 Berkshire Hathaway annual report below. You can navigate through the pages in the report by either clicking on the pages listed below, or by using the keyword search tool below to find specific information within the annual report.-
 1
1 -
2
-
3
-
4
-
5
-
6
-
7
-
8
-
9
-
10
-
11
-
12
-
13
-
14
-
15
-
16
-
17
-
18
-
19
-
20
-
21
-
22
-
23
-
24
-
 25
25 -
 26
26 -
 27
27 -
 28
28 -
 29
29 -
 30
30 -
 31
31 -
 32
32 -
 33
33 -
 34
34 -
 35
35 -
 36
36 -
 37
37 -
 38
38 -
 39
39 -
 40
40 -
 41
41 -
 42
42 -
 43
43 -
 44
44 -
 45
45 -
46
-
47
-
48
-
49
-
50
-
51
-
52
-
53
-
54
-
55
-
56
-
57
-
58
-
59
-
60
-
61
-
62
-
63
-
64
-
65
-
66
-
67
-
68
-
69
-
70
-
71
-
72
-
73
-
74
-
75
-
76
-
77
-
78
 |
 |

34
Notes to Consolidated Financial Statements (Continued)
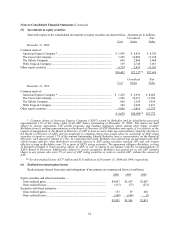
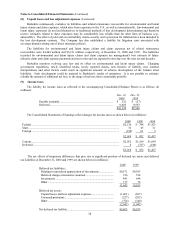
(5) Investments in equity securities
Data with respect to the consolidated investments in equity securities are shown below. Amounts are in millions.
Unrealized Fair
Cost Gains Value
December 31, 2000
Common stock of:
American Express Company * ....................................................................... $ 1,470 $ 6,859 $ 8,329
The Coca-Cola Company ............................................................................... 1,299 10,889 12,188
The Gillette Company.................................................................................... 600 2,868 3,468
Wells Fargo & Company................................................................................ 319 2,748 3,067
Other equity securities ...................................................................................... 6,714 3,853 10,567
$10,402 $27,217** $37,619
Unrealized Fair
Cost Gains Value
December 31, 1999
Common stock of:
American Express Company * ....................................................................... $ 1,470 $ 6,932 $ 8,402
The Coca-Cola Company ............................................................................... 1,299 10,351 11,650
The Gillette Company.................................................................................... 600 3,354 3,954
Wells Fargo & Company................................................................................ 349 2,042 2,391
Other equity securities ...................................................................................... 5,956 5,419 11,375
$ 9,674 $28,098** $37,772
* Common shares of American Express Company ("AXP") owned by Berkshire and its subsidiaries possessed
approximately 11% of the voting rights of all AXP shares outstanding at December 31, 2000. The shares are held
subject to various agreements with certain insurance and banking regulators which, among other things, prohibit
Berkshire from (i) seeking representation on the Board of Directors of AXP (Berkshire may agree, if it so desires, at the
request of management or the Board of Directors of AXP to have no more than one representative stand for election to
the Board of Directors of AXP) and (ii) acquiring or retaining shares that would cause its ownership of AXP voting
securities to equal or exceed 17% of the amount outstanding (should Berkshire have a representative on the Board of
Directors, such amount is limited to 15%). In connection therewith, Berkshire has entered into an agreement with AXP
which became effective when Berkshire's ownership interest in AXP voting securities reached 10% and will remain
effective so long as Berkshire owns 5% or more of AXP's voting securities. The agreement obligates Berkshire, so long
as Kenneth Chenault is chief executive officer of AXP, to vote its shares in accordance with the recommendations of
AXP's Board of Directors. Additionally, subject to certain exceptions, Berkshire has agreed not to sell AXP common
shares to any person who owns 5% or more of AXP voting securities or seeks to control AXP, without the consent of
AXP.
** Net of unrealized losses of $77 million and $131 million as of December 31, 2000 and 1999, respectively.
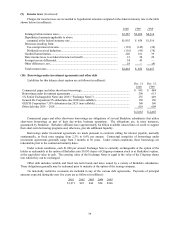
(6) Realized investment gains (losses)
Realized gains (losses) from sales and redemptions of investments are summarized below (in millions):
2000 1999 1998
Equity securities and other investments —
Gross realized gains................................................................................ $4,467 $1,507 $2,087
Gross realized losses ............................................................................... (317) (77) (272)
Securities with fixed maturities —
Gross realized gains................................................................................ 153 39 602
Gross realized losses ............................................................................... (348) (104) (2)
$3,955 $1,365 $2,415