Berkshire Hathaway 2000 Annual Report Download - page 51
Download and view the complete annual report
Please find page 51 of the 2000 Berkshire Hathaway annual report below. You can navigate through the pages in the report by either clicking on the pages listed below, or by using the keyword search tool below to find specific information within the annual report.-
 1
1 -
2
-
3
-
4
-
5
-
6
-
7
-
8
-
9
-
10
-
11
-
12
-
13
-
14
-
15
-
16
-
17
-
18
-
19
-
20
-
21
-
22
-
23
-
24
-
25
-
26
-
27
-
28
-
29
-
30
-
31
-
32
-
33
-
34
-
35
-
36
-
37
-
38
-
39
-
40
-
 41
41 -
 42
42 -
 43
43 -
 44
44 -
 45
45 -
 46
46 -
 47
47 -
 48
48 -
 49
49 -
 50
50 -
 51
51 -
 52
52 -
 53
53 -
 54
54 -
 55
55 -
 56
56 -
 57
57 -
 58
58 -
 59
59 -
 60
60 -
 61
61 -
62
-
63
-
64
-
65
-
66
-
67
-
68
-
69
-
70
-
71
-
72
-
73
-
74
-
75
-
76
-
77
-
78
 |
 |

50
Management's Discussion (Continued)
Insurance — Underwriting (Continued)
General Re (Continued)
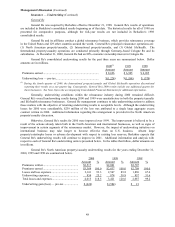
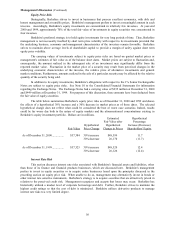
The International property/casualty operations write quota-share and excess reinsurance on risks around
the world. In recent years, the largest international markets have been in Germany and Western Europe. As
previously noted, the International property/casualty operations discontinued reporting their results on a one-
quarter lag during the fourth quarter of 2000. Results for the 2000 period contain fifteen months, or one additional
quarter of information. The preceding table shows underwriting results for both the twelve month and fifteen
month periods. The comparative analysis that follows excludes the additional quarter, with results for the
additional three month period of 2000 discussed separately afterward.
Premiums earned in the twelve months of 2000 exceeded 1999 amounts by 5.8%, whereas 1999 premiums
earned exceeded 1998 levels by 11.8%. Adjusting for the effects of overall declining foreign exchange rates,
earned premiums in local currencies grew 16.7% during 2000 and 12.0% during 1999. The growth in 2000 earned
premiums was primarily due to increased premiums in European markets outside Germany, premiums which
became due in 2000 to reinstate coverage as a result of fourth quarter 1999 European winter storm losses, new
business in South America, and the effect of increased volume and participation in DP Mann’s Syndicate 435 at
Lloyd’s of London. This growth was partially offset by the cancellation of some significant quota-share treaties.
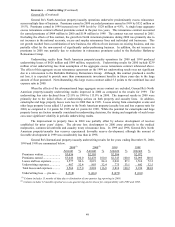
Underwriting results for General Re’s International property/casualty segment for 2000 remained very
bad. Loss and loss expense ratios for the twelve months of 2000 were 84.4% as compared to 87.1% for 1999 and
72.3% for 1998. The decrease in the loss ratio from 1999 was primarily due to lower levels of catastrophe and
other large losses in 2000. The effect of catastrophes and other large property losses represented 5.9 points of the
loss and loss expense ratio for 2000, compared to 5.4 points for 1999. The loss and loss expense ratio for 1999 also
included approximately 4.0 points related to coverages for the motion picture business, which has since been
discontinued. In 1998, catastrophe losses represented 1.3 points. Due to the large amount of property business
written in the International property/casualty operations, periodic underwriting results can be volatile.
The International property/casualty business generated an underwriting loss of $102 million during the
additional quarter being reported in the 2000 financial statements (three month period ended December 31, 2000).
The results were adversely affected by two catastrophes involving flood losses in the United Kingdom and Italy,
totaling $25 million.
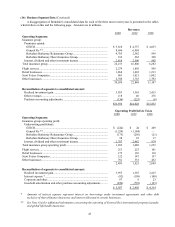
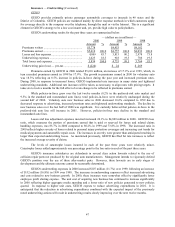
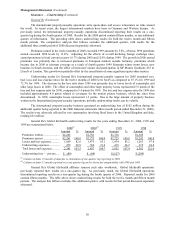
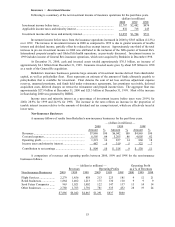
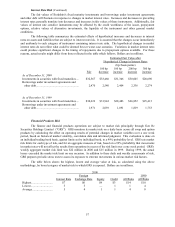
General Re’s Global life/health underwriting results for the years ending December 31, 2000, 1999 and
1998 are summarized below.
2000
(1)
2000
(2)
1999 1998
Amount %Amount %Amount %Amount %
Premiums written...................... $2,263 $1,781 $1,736 $1,305
Premiums earned ...................... $2,261 100.0 $1,773 100.0 $1,725 100.0 $1,292 100.0
Losses and loss expenses........... 1,869 82.6 1,473 83.1 1,434 83.2 1,263 97.8
Underwriting expenses.............. 472 20.9 384 21.6 418 24.2 319 24.6
Total losses and expenses.......... 2,341 103.5 1,857 104.7 1,852 107.4 1,582 122.4
Underwriting loss — pre-tax..... $ (80)$ (84)$ (127)$ (290)
(1) Column includes 15 months of data due to elimination of one-quarter lag reporting in 2000.
(2) Column includes 12 months reported on a one-quarter lag and is shown for comparability with 1999 and 1998.
General Re’s Global life/health affiliates reinsure such risks worldwide. Global life/health operations
previously reported their results on a one-quarter lag. As previously noted, the Global life/health operations
discontinued reporting results on a one-quarter lag during the fourth quarter of 2000. Reported results for 2000
contain fifteen months. The table above shows underwriting results for both the twelve month and fifteen month
periods. The analysis that follows excludes this additional quarter, with results for that period discussed separately
afterward.