Berkshire Hathaway 2000 Annual Report Download - page 25
Download and view the complete annual report
Please find page 25 of the 2000 Berkshire Hathaway annual report below. You can navigate through the pages in the report by either clicking on the pages listed below, or by using the keyword search tool below to find specific information within the annual report.-
 1
1 -
2
-
3
-
4
-
5
-
6
-
7
-
8
-
9
-
10
-
11
-
12
-
13
-
14
-
 15
15 -
 16
16 -
 17
17 -
 18
18 -
 19
19 -
 20
20 -
 21
21 -
 22
22 -
 23
23 -
 24
24 -
 25
25 -
 26
26 -
 27
27 -
 28
28 -
 29
29 -
 30
30 -
 31
31 -
 32
32 -
 33
33 -
 34
34 -
 35
35 -
36
-
37
-
38
-
39
-
40
-
41
-
42
-
43
-
44
-
45
-
46
-
47
-
48
-
49
-
50
-
51
-
52
-
53
-
54
-
55
-
56
-
57
-
58
-
59
-
60
-
61
-
62
-
63
-
64
-
65
-
66
-
67
-
68
-
69
-
70
-
71
-
72
-
73
-
74
-
75
-
76
-
77
-
78
 |
 |

24
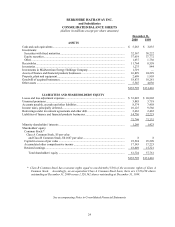
BERKSHIRE HATHAWAY INC.
and Subsidiaries
CONSOLIDATED BALANCE SHEETS
(dollars in millions except per share amounts)
December 31,
2000 1999
ASSETS
Cash and cash equivalents............................................................................................... $ 5,263 $ 3,835
Investments:
Securities with fixed maturities..................................................................................... 32,567 30,222
Equity securities........................................................................................................... 37,619 37,772
Other ........................................................................................................................... 1,637 1,736
Receivables..................................................................................................................... 11,764 8,558
Inventories...................................................................................................................... 1,275 844
Investments in MidAmerican Energy Holdings Company ................................................ 1,719 —
Assets of finance and financial products businesses ......................................................... 16,829 24,229
Property, plant and equipment......................................................................................... 2,699 1,903
Goodwill of acquired businesses...................................................................................... 18,875 18,281
Other assets .................................................................................................................... 5,545 4,036
$135,792 $131,416
LIABILITIES AND SHAREHOLDERS’ EQUITY
Losses and loss adjustment expenses ............................................................................... $ 33,022 $ 26,802
Unearned premiums........................................................................................................ 3,885 3,718
Accounts payable, accruals and other liabilities ............................................................... 8,374 7,458
Income taxes, principally deferred................................................................................... 10,125 9,566
Borrowings under investment agreements and other debt ................................................. 2,663 2,465
Liabilities of finance and financial products businesses.................................................... 14,730 22,223
72,799 72,232
Minority shareholders’ interests ...................................................................................... 1,269 1,423
Shareholders’ equity:
Common Stock:*
Class A Common Stock, $5 par value
and Class B Common Stock, $0.1667 par value....................................................... 8 8
Capital in excess of par value ....................................................................................... 25,524 25,209
Accumulated other comprehensive income ................................................................... 17,543 17,223
Retained earnings......................................................................................................... 18,649 15,321
Total shareholders’ equity ....................................................................................... 61,724 57,761
$135,792 $131,416
* Class B Common Stock has economic rights equal to one-thirtieth (1/30) of the economic rights of Class A
Common Stock. Accordingly, on an equivalent Class A Common Stock basis, there are 1,526,230 shares
outstanding at December 31, 2000 versus 1,520,562 shares outstanding at December 31, 1999.
See accompanying Notes to Consolidated Financial Statements