Berkshire Hathaway 2000 Annual Report Download - page 56
Download and view the complete annual report
Please find page 56 of the 2000 Berkshire Hathaway annual report below. You can navigate through the pages in the report by either clicking on the pages listed below, or by using the keyword search tool below to find specific information within the annual report.-
 1
1 -
2
-
3
-
4
-
5
-
6
-
7
-
8
-
9
-
10
-
11
-
12
-
13
-
14
-
15
-
16
-
17
-
18
-
19
-
20
-
21
-
22
-
23
-
24
-
25
-
26
-
27
-
28
-
29
-
30
-
31
-
32
-
33
-
34
-
35
-
36
-
37
-
38
-
39
-
40
-
41
-
42
-
43
-
44
-
45
-
 46
46 -
 47
47 -
 48
48 -
 49
49 -
 50
50 -
 51
51 -
 52
52 -
 53
53 -
 54
54 -
 55
55 -
 56
56 -
 57
57 -
 58
58 -
 59
59 -
 60
60 -
 61
61 -
 62
62 -
 63
63 -
 64
64 -
 65
65 -
 66
66 -
67
-
68
-
69
-
70
-
71
-
72
-
73
-
74
-
75
-
76
-
77
-
78
 |
 |

55
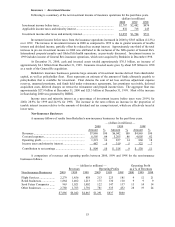
Non-Insurance Businesses (Continued)
Other Businesses (Continued)
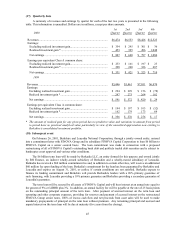
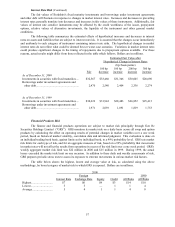
Revenues in 2000 of this group of businesses increased approximately $1,017 million (57.7%) over 1999.
Operating profits of these businesses in 2000 exceeded 1999 by $446 million (133%). Approximately $600 million
of the increase in revenues and $85 million of the increase in operating profits was attributed to the aforementioned
business acquisitions. In addition, a significant increase in net revenues and operating profits was generated by
Berkshire’s finance and financial products businesses. The increase in operating profits of the finance and
financial products businesses in 2000 was produced primarily from realized gains on a large portfolio of fixed
maturity securities acquired in 1999 pursuant to a proprietary trading strategy. These securities were disposed of
during 2000. Partially offsetting the realized gains on trading securities in 2000 were operating losses at GRS.
1999 compared to 1998
Revenues from the non-insurance businesses increased $1,177 million (24.2%) in 1999 as compared to
1998. Operating profits of $837 million during 1999 decreased $23 million (2.7%) from the comparable 1998
amount. The most significant factor giving rise to the revenue increase was the inclusion of Executive Jet for a full
year in 1999 versus just under five months during 1998. Operating profits increased at Berkshire’s Flight Services,
Retail and Scott Fetzer business segments. However, more than offsetting these increases was a decline of $87
million in operating profits from Berkshire’s finance and financial products businesses.
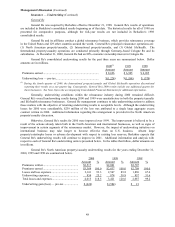
Goodwill amortization and other purchase-accounting adjustments
Goodwill amortization and other purchase-accounting adjustments reflect the after-tax effect on net
earnings with respect to the amortization of goodwill of acquired businesses and the amortization of fair value
adjustments to certain assets and liabilities which were recorded at the business acquisition dates. The increase in
2000 as compared to 1999 is primarily due to the inclusion of a charge of $219 million related to the write-off of
goodwill related to Dexter Shoe (see Note 1(g) to the Consolidated Financial Statements). The significant increase
in such charges during 1999 as compared to 1998 periods is primarily due to the acquisition of General Re at the
end of 1998.
Other purchase-accounting adjustments consist primarily of the amortization of the excess market value
over the historical cost of fixed maturity investments that existed as of the date of certain business acquisitions,
principally GEICO and General Re. Such excess is included in Berkshire’s cost of the investments and is being
amortized over the estimated remaining lives of the assets. The unamortized excess remaining in the cost of fixed
maturity investments was $680 million at December 31, 2000, $940 million at December 31, 1999 and $1.2 billion
at December 31, 1998.
Realized Investment Gain
Realized investment gain has been a recurring element in Berkshire's net earnings for many years. The
amount — recorded when investments are sold, other-than-temporarily impaired or in certain situations, as
required by GAAP, when investments are marked-to-market with the corresponding gain or loss included in
earnings — may fluctuate significantly from period to period, with a meaningful effect upon Berkshire's
consolidated net earnings. However, the amount of realized investment gain or loss for any given period has no
predictive value, and variations in amount from period to period have no practical analytical value, particularly in
view of the net unrealized price appreciation now existing in Berkshire's consolidated investment portfolio.
While the effects of realized gains are often material to the Consolidated Statements of Earnings, such
gains often produce a minimal impact on Berkshire's total shareholders' equity. This is due to the fact that
Berkshire's investments are carried in prior periods' consolidated financial statements at market value with
unrealized gains, net of tax, reported as a separate component of shareholders' equity.
Market Risk Disclosures
Berkshire's Consolidated Balance Sheet includes a substantial amount of assets and liabilities whose fair
values are subject to market risks. Berkshire’s significant market risks are primarily associated with equity prices
and interest rates and to a lesser degree financial products. The following sections address the significant market
risks associated with Berkshire's business activities.