Berkshire Hathaway 2000 Annual Report Download - page 47
Download and view the complete annual report
Please find page 47 of the 2000 Berkshire Hathaway annual report below. You can navigate through the pages in the report by either clicking on the pages listed below, or by using the keyword search tool below to find specific information within the annual report.-
 1
1 -
2
-
3
-
4
-
5
-
6
-
7
-
8
-
9
-
10
-
11
-
12
-
13
-
14
-
15
-
16
-
17
-
18
-
19
-
20
-
21
-
22
-
23
-
24
-
25
-
26
-
27
-
28
-
29
-
30
-
31
-
32
-
33
-
34
-
35
-
36
-
 37
37 -
 38
38 -
 39
39 -
 40
40 -
 41
41 -
 42
42 -
 43
43 -
 44
44 -
 45
45 -
 46
46 -
 47
47 -
 48
48 -
 49
49 -
 50
50 -
 51
51 -
 52
52 -
 53
53 -
 54
54 -
 55
55 -
 56
56 -
 57
57 -
58
-
59
-
60
-
61
-
62
-
63
-
64
-
65
-
66
-
67
-
68
-
69
-
70
-
71
-
72
-
73
-
74
-
75
-
76
-
77
-
78
 |
 |

46
BERKSHIRE HATHAWAY INC.
Management's Discussion and Analysis of
Financial Condition and Results of Operations
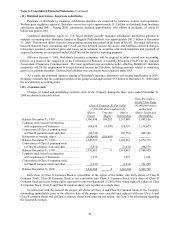
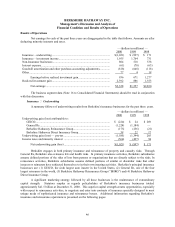
Results of Operations
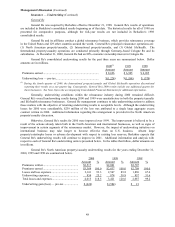
Net earnings for each of the past three years are disaggregated in the table that follows. Amounts are after
deducting minority interests and taxes.
— (dollars in millions) —
2000 1999 1998
Insurance – underwriting .............................................................................................. $(1,021) $ (897) $ 171
Insurance – investment income.................................................................... 1,955 1,764 731
Non-Insurance businesses ............................................................................ 804 518 538
Interest expense ........................................................................................... (61) (70) (63)
Goodwill amortization and other purchase-accounting adjustments.............. (818) (648) (118)
Other ........................................................................................................... 77 4 18
Earnings before realized investment gain.......................................... 936 671 1,277
Realized investment gain ............................................................................. 2,392 886 1,553
Net earnings ..................................................................................... $3,328 $1,557 $2,830
The business segment data (Note 16 to Consolidated Financial Statements) should be read in conjunction
with this discussion.
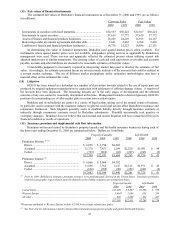
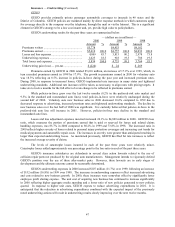
Insurance — Underwriting
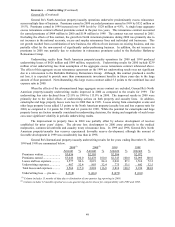
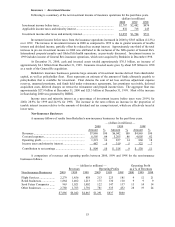
A summary follows of underwriting results from Berkshire’s insurance businesses for the past three years.
— (dollars in millions) —
2000 1999 1998
Underwriting gain (loss) attributable to:
GEICO................................................................................................... $ (224) $ 24 $ 269
General Re ............................................................................................. (1,224) (1,184) —
Berkshire Hathaway Reinsurance Group................................................. (175) (256) (21)
Berkshire Hathaway Direct Insurance Group.......................................... 38 22 17
Underwriting gain (loss) — pre-tax ............................................................. (1,585) (1,394) 265
Income taxes and minority interest ............................................................. (564) (497) 94
Net underwriting gain (loss) ............................................................. $(1,021)$ (897)$ 171
Berkshire engages in both primary insurance and reinsurance of property and casualty risks. Through
General Re, Berkshire also reinsures life and health risks. In primary insurance activities, Berkshire subsidiaries
assume defined portions of the risks of loss from persons or organizations that are directly subject to the risks. In
reinsurance activities, Berkshire subsidiaries assume defined portions of similar or dissimilar risks that other
insurers or reinsurers have subjected themselves to in their own insuring activities. Berkshire’s principal insurance
businesses are: (1) GEICO, the sixth largest auto insurer in the United States, (2) General Re, one of the four
largest reinsurers in the world, (3) Berkshire Hathaway Reinsurance Group (“BHRG”) and (4) Berkshire Hathaway
Direct Insurance Group.
A significant marketing strategy followed by all these businesses is the maintenance of extraordinary
capital strength. Statutory surplus as regards policyholders of Berkshire’s insurance businesses totaled
approximately $41.5 billion at December 31, 2000. This superior capital strength creates opportunities, especially
with respect to reinsurance activities, to negotiate and enter into contracts of insurance specially designed to meet
unique needs of sophisticated insurance and reinsurance buyers. Additional information regarding Berkshire’s
insurance and reinsurance operations is presented on the following pages.