Berkshire Hathaway 2000 Annual Report Download - page 50
Download and view the complete annual report
Please find page 50 of the 2000 Berkshire Hathaway annual report below. You can navigate through the pages in the report by either clicking on the pages listed below, or by using the keyword search tool below to find specific information within the annual report.-
 1
1 -
2
-
3
-
4
-
5
-
6
-
7
-
8
-
9
-
10
-
11
-
12
-
13
-
14
-
15
-
16
-
17
-
18
-
19
-
20
-
21
-
22
-
23
-
24
-
25
-
26
-
27
-
28
-
29
-
30
-
31
-
32
-
33
-
34
-
35
-
36
-
37
-
38
-
39
-
 40
40 -
 41
41 -
 42
42 -
 43
43 -
 44
44 -
 45
45 -
 46
46 -
 47
47 -
 48
48 -
 49
49 -
 50
50 -
 51
51 -
 52
52 -
 53
53 -
 54
54 -
 55
55 -
 56
56 -
 57
57 -
 58
58 -
 59
59 -
 60
60 -
61
-
62
-
63
-
64
-
65
-
66
-
67
-
68
-
69
-
70
-
71
-
72
-
73
-
74
-
75
-
76
-
77
-
78
 |
 |

49
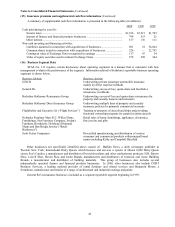
Insurance — Underwriting (Continued)
General Re (Continued)
General Re’s North American property/casualty operations underwrite predominantly excess reinsurance
across multiple lines of business. Premiums earned in 2000 exceeded premiums earned in 1999 by $552 million or
19.5%. Premiums earned in 1999 increased over 1998 levels by $129 million or 4.8%. A single large aggregate
excess reinsurance contract affected premiums earned in the past two years. This reinsurance contract accounted
for earned premiums of $404 million in 2000 and $154 million in 1999. The contract was not renewed in 2001.
Excluding the effects of this contract, the growth in North American premiums during 2000 was primarily due to
net increases in the national accounts, excess and surplus reinsurance lines and individual risk businesses. This
net growth resulted from a combination of new business, the effects of rate increases on existing business, and was
partially offset by the non-renewal of significantly under-performing business. In addition, the net increase in
premiums in 2000 was partially due to reductions in reinsurance premiums ceded to the Berkshire Hathaway
Reinsurance Group.
Underwriting results from North American property/casualty operations for 2000 and 1999 produced
underwriting losses of $626 million and $584 million, respectively. Underwriting results for 2000 include $239
million of net underwriting loss from assumption of the aggregate excess reinsurance contract referenced above.
The effect of this aggregate excess reinsurance agreement on the 1999 net underwriting results was not significant
due to a retrocession to the Berkshire Hathaway Reinsurance Group. Although, this contract produced a sizable
net loss, it is expected to provide more than commensurate investment benefits in future years due to the large
amount of float generated. Notwithstanding, this large excess contract added 5.5 points to the combined loss and
expense ratio in 2000.
When the effects of the aforementioned large aggregate excess contract are excluded, General Re’s North
American property/casualty underwriting results improved in 2000 as compared to the results for 1999. The
underwriting loss ratio declined from 121.8% in 1999 to 113.0% in 2000. The improved results in 2000 were
primarily due to the initial effects of underwriting actions on both property and casualty lines. In addition,
catastrophe and large property losses were less in 2000 than in 1999. Losses arising from catastrophic events and
other large property losses added 3.5 points to the North American property/casualty loss and loss expense ratio for
2000, as compared to 9.4 points for 1999 and 4.1 points for 1998. While the potential for catastrophe and large
property losses are factors normally considered in underwriting decisions, the timing and magnitude of such losses
can cause significant volatility in periodic underwriting results.
The improvement in property lines in 2000 was partially offset by adverse development of reserves
established for prior years' claims. The adverse loss development in 2000 arose primarily in the medical
malpractice, commercial umbrella and casualty treaty reinsurance lines. In 1999 and 1998, General Re’s North
American property/casualty loss reserves experienced favorable reserve development, although the amount of
favorable development in 1999 was considerably less than in 1998.
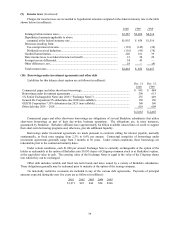
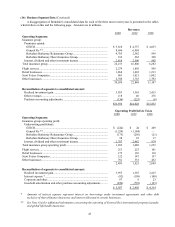
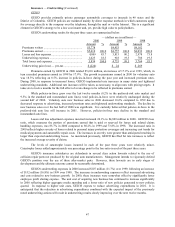
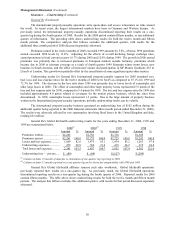
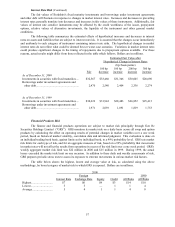
General Re’s International property/casualty underwriting results for the years ending December 31, 2000,
1999 and 1998 are summarized below.
2000
(1)
2000
(2)
1999 1998
Amount %Amount %Amount %Amount %
Premiums written....................... $3,036 $2,505 $2,506 $2,072
Premiums earned ....................... $3,046 100.0 $2,478 100.0 $2,343 100.0 $2,095 100.0
Losses and loss expenses............ 2,577 84.6 2,091 84.4 2,041 87.1 1,514 72.3
Underwriting expenses............... 987 32.4 803 32.4 775 33.1 682 32.5
Total losses and expenses........... 3,564 117.0 2,894 116.8 2,816 120.2 2,196 104.8
Underwriting loss — pre-tax...... $ (518)$ (416)$ (473)$ (101)
(1) Column includes 15 months of data due to elimination of one-quarter lag reporting in 2000.
(2) Column includes 12 months reported on a one-quarter lag and is shown for comparability with 1999 and 1998.