Berkshire Hathaway 2000 Annual Report Download - page 70
Download and view the complete annual report
Please find page 70 of the 2000 Berkshire Hathaway annual report below. You can navigate through the pages in the report by either clicking on the pages listed below, or by using the keyword search tool below to find specific information within the annual report.-
 1
1 -
2
-
3
-
4
-
5
-
6
-
7
-
8
-
9
-
10
-
11
-
12
-
13
-
14
-
15
-
16
-
17
-
18
-
19
-
20
-
21
-
22
-
23
-
24
-
25
-
26
-
27
-
28
-
29
-
30
-
31
-
32
-
33
-
34
-
35
-
36
-
37
-
38
-
39
-
40
-
41
-
42
-
43
-
44
-
45
-
46
-
47
-
48
-
49
-
50
-
51
-
52
-
53
-
54
-
55
-
56
-
57
-
58
-
59
-
 60
60 -
 61
61 -
 62
62 -
 63
63 -
 64
64 -
 65
65 -
 66
66 -
 67
67 -
 68
68 -
 69
69 -
 70
70 -
 71
71 -
 72
72 -
 73
73 -
 74
74 -
 75
75 -
 76
76 -
 77
77 -
 78
78
 |
 |

69
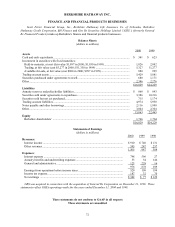
BERKSHIRE HATHAWAY INC.
INSURANCE GROUP
Balance Sheets
(dollars in millions)
December 31,
2000 1999
Assets
Investments:
Fixed maturities at market................................................................................................. $32,381 $30,217
Equity securities and other investments at market:
American Express Company........................................................................................ 8,147 8,218
The Coca-Cola Company ............................................................................................. 12,159 11,622
Freddie Mac................................................................................................................. 146 2,803
The Gillette Company.................................................................................................. 3,468 3,954
Wells Fargo & Company.............................................................................................. 2,964 2,316
Other ........................................................................................................................... 12,008 10,256
71,273 69,386
Cash and cash equivalents.................................................................................................... 4,700 2,981
Deferred costs ...................................................................................................................... 3,508 2,309
Other ................................................................................................................................... 12,808 9,490
$92,289 $84,166
Liabilities
Losses and loss adjustment expenses .................................................................................... $33,022 $26,802
Unearned premiums............................................................................................................. 3,885 3,718
Policyholder liabilities and other accruals ............................................................................ 6,986 6,537
Income taxes, principally deferred........................................................................................ 9,729 9,430
53,622 46,487
Equity
Minority shareholders’ ......................................................................................................... 1,157 1,337
Berkshire shareholders’ ....................................................................................................... 37,510 36,342
38,667 37,679
$92,289 $84,166
Statements of Earnings
(dollars in millions)
2000 1999 1998
Premiums written .................................................................................................... $19,662 $14,667 $5,476
Premiums earned ..................................................................................................... $19,343 $14,306 $5,300
Losses and loss expenses.......................................................................................... 17,326 12,518 3,904
Underwriting expenses ............................................................................................ 3,602 3,182 1,131
Total losses and expenses...................................................................................... 20,928 15,700 5,035
Underwriting gain (loss) — pre-tax ......................................................................... (1,585) (1,394) 265
Net investment income* .......................................................................................... 2,811 2,488 974
Realized investment gain ......................................................................................... 3,920 1,364 2,462
Earnings before income taxes .................................................................................. 5,146 2,458 3,701
Income tax expense.................................................................................................. 1,604 672 1,186
3,542 1,786 2,515
Minority interest...................................................................................................... 230 35 17
Net earnings ............................................................................................................ $ 3,312 $ 1,751 $2,498
* Net investment income is summarized below:
Dividends....................................................................................................................... $ 493 $ 476 $363
Interest........................................................................................................................... 2,340 2,030 621
Investment expenses........................................................................................................ (22) (18) (10)
$2,811 $2,488 $974
These statements do not conform to GAAP in all respects
These statements are unaudited