Berkshire Hathaway 2000 Annual Report Download - page 36
Download and view the complete annual report
Please find page 36 of the 2000 Berkshire Hathaway annual report below. You can navigate through the pages in the report by either clicking on the pages listed below, or by using the keyword search tool below to find specific information within the annual report.-
 1
1 -
2
-
3
-
4
-
5
-
6
-
7
-
8
-
9
-
10
-
11
-
12
-
13
-
14
-
15
-
16
-
17
-
18
-
19
-
20
-
21
-
22
-
23
-
24
-
25
-
 26
26 -
 27
27 -
 28
28 -
 29
29 -
 30
30 -
 31
31 -
 32
32 -
 33
33 -
 34
34 -
 35
35 -
 36
36 -
 37
37 -
 38
38 -
 39
39 -
 40
40 -
 41
41 -
 42
42 -
 43
43 -
 44
44 -
 45
45 -
 46
46 -
47
-
48
-
49
-
50
-
51
-
52
-
53
-
54
-
55
-
56
-
57
-
58
-
59
-
60
-
61
-
62
-
63
-
64
-
65
-
66
-
67
-
68
-
69
-
70
-
71
-
72
-
73
-
74
-
75
-
76
-
77
-
78
 |
 |

35
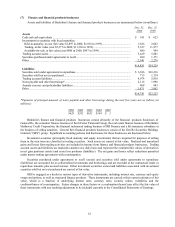
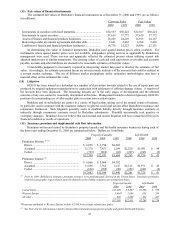
(7) Finance and financial products businesses
Assets and liabilities of Berkshire's finance and financial products businesses are summarized below (in millions).
Dec. 31,
2000 Dec. 31,
1999
Assets
Cash and cash equivalents ....................................................................................................... $ 341 $ 623
Investments in securities with fixed maturities:
Held-to-maturity, at cost (fair value $1,897 in 2000; $1,930 in 1999)...................................... 1,826 2,002
Trading, at fair value (cost $5,277 in 2000; $11,330 in 1999) ................................................. 5,327 11,277
Available-for-sale, at fair value (cost $880 in 2000; $997 in 1999) ......................................... 880 999
Trading account assets............................................................................................................. 5,429 5,881
Securities purchased under agreements to resell........................................................................ 680 1,171
Other ...................................................................................................................................... 2,346 2,276
$16,829 $24,229
Liabilities
Securities sold under agreements to repurchase......................................................................... $ 3,386 $10,216
Securities sold but not yet purchased........................................................................................ 715 1,174
Trading account liabilities........................................................................................................ 4,974 5,930
Notes payable and other borrowings*....................................................................................... 2,116 1,998
Annuity reserves and policyholder liabilities ............................................................................ 868 843
Other ...................................................................................................................................... 2,671 2,062
$14,730 $22,223
*Payments of principal amounts of notes payable and other borrowings during the next five years are as follows (in
millions):
2001 2002 2003 2004 2005
$629 $242 $651 $184 $ 1
Berkshire’s finance and financial products businesses consist primarily of the financial products businesses of
General Re, the consumer finance business of Scott Fetzer Financial Group, the real estate finance business of Berkshire
Hathaway Credit Corporation, the financial instrument trading business of BH Finance and a life insurance subsidiary in
the business of selling annuities. General Re’s financial products businesses consist of the Gen Re Securities Holdings
Limited (“GRS”) group. Significant accounting policies and disclosures for these businesses are discussed below.
Investment securities (principally fixed maturity and equity investments) that are acquired for purposes of selling
them in the near term are classified as trading securities. Such assets are carried at fair value. Realized and unrealized
gains and losses from trading activities are included in income from finance and financial products businesses. Trading
account assets and liabilities are marked-to-market on a daily basis and represent the estimated fair values of derivatives
in net gain positions (assets) and in net loss positions (liabilities). The net gains and losses reflect reductions permitted
under master netting agreements with counterparties.
Securities purchased under agreements to resell (assets) and securities sold under agreements to repurchase
(liabilities) are accounted for as collateralized investments and borrowings and are recorded at the contractual resale or
repurchase amounts plus accrued interest. Other investment securities owned and liabilities associated with investment
securities sold but not yet purchased are carried at fair value.
GRS is engaged as a dealer in various types of derivative instruments, including interest rate, currency and equity
swaps and options, as well as structured finance products. These instruments are carried at their current estimates of fair
value, which is a function of underlying interest rates, currency rates, security values, volatilities and the
creditworthiness of counterparties. Future changes in these factors or a combination thereof may affect the fair value of
these instruments with any resulting adjustment to be included currently in the Consolidated Statements of Earnings.