Berkshire Hathaway 2000 Annual Report Download - page 23
Download and view the complete annual report
Please find page 23 of the 2000 Berkshire Hathaway annual report below. You can navigate through the pages in the report by either clicking on the pages listed below, or by using the keyword search tool below to find specific information within the annual report.-
 1
1 -
2
-
3
-
4
-
5
-
6
-
7
-
8
-
9
-
10
-
11
-
12
-
 13
13 -
 14
14 -
 15
15 -
 16
16 -
 17
17 -
 18
18 -
 19
19 -
 20
20 -
 21
21 -
 22
22 -
 23
23 -
 24
24 -
 25
25 -
 26
26 -
 27
27 -
 28
28 -
 29
29 -
 30
30 -
 31
31 -
 32
32 -
 33
33 -
34
-
35
-
36
-
37
-
38
-
39
-
40
-
41
-
42
-
43
-
44
-
45
-
46
-
47
-
48
-
49
-
50
-
51
-
52
-
53
-
54
-
55
-
56
-
57
-
58
-
59
-
60
-
61
-
62
-
63
-
64
-
65
-
66
-
67
-
68
-
69
-
70
-
71
-
72
-
73
-
74
-
75
-
76
-
77
-
78
 |
 |

22
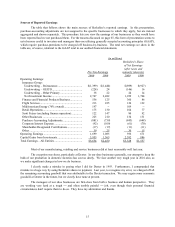
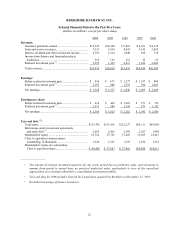
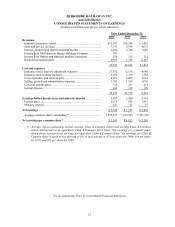
BERKSHIRE HATHAWAY INC.
Selected Financial Data for the Past Five Years
(dollars in millions, except per share data)
2000 1999 1998 1997 1996
Revenues:
Insurance premiums earned........................................ $19,343 $14,306 $ 5,481 $ 4,761 $ 4,118
Sales and service revenues.......................................... 7,331 5,918 4,675 3,615 3,095
Interest, dividend and other investment income .......... 2,791 2,314 1,049 916 778
Income from finance and financial products
businesses................................................................ 556 125 212 32 25
Realized investment gain
(1)
........................................ 3,955 1,365 2,415 1,106 2,484
Total revenues ............................................................ $33,976 $24,028 $13,832 $10,430 $10,500
Earnings:
Before realized investment gain.................................. $ 936 $ 671 $ 1,277 $ 1,197 $ 884
Realized investment gain
(1)
........................................ 2,392 886 1,553 704 1,605
Net earnings............................................................... $ 3,328 $ 1,557 $ 2,830 $ 1,901 $ 2,489
Earnings per share:
Before realized investment gain.................................. $ 614 $ 442 $ 1,021 $ 971 $ 733
Realized investment gain
(1)
........................................ 1,571 583 1,241 571 1,332
Net earnings............................................................... $ 2,185 $ 1,025 $ 2,262 $ 1,542 $ 2,065
Year-end data (2):
Total assets................................................................. $135,792 $131,416 $122,237 $56,111 $43,409
Borrowings under investment agreements
and other debt
(3)
...................................................... 2,663 2,465 2,385 2,267 1,944
Shareholders’ equity ................................................... 61,724 57,761 57,403 31,455 23,427
Class A equivalent common shares
outstanding, in thousands ........................................ 1,526 1,521 1,519 1,234 1,232
Shareholders’ equity per outstanding
Class A equivalent share.......................................... $ 40,442 $ 37,987 $ 37,801 $25,488 $19,011
_________________
(1) The amount of realized investment gain/loss for any given period has no predictive value, and variations in
amount from period to period have no practical analytical value, particularly in view of the unrealized
appreciation now existing in Berkshire's consolidated investment portfolio.
(2) Year-end data for 1998 includes General Re Corporation acquired by Berkshire on December 21, 1998.
(3) Excludes borrowings of finance businesses.