Berkshire Hathaway 2000 Annual Report Download - page 54
Download and view the complete annual report
Please find page 54 of the 2000 Berkshire Hathaway annual report below. You can navigate through the pages in the report by either clicking on the pages listed below, or by using the keyword search tool below to find specific information within the annual report.-
 1
1 -
2
-
3
-
4
-
5
-
6
-
7
-
8
-
9
-
10
-
11
-
12
-
13
-
14
-
15
-
16
-
17
-
18
-
19
-
20
-
21
-
22
-
23
-
24
-
25
-
26
-
27
-
28
-
29
-
30
-
31
-
32
-
33
-
34
-
35
-
36
-
37
-
38
-
39
-
40
-
41
-
42
-
43
-
 44
44 -
 45
45 -
 46
46 -
 47
47 -
 48
48 -
 49
49 -
 50
50 -
 51
51 -
 52
52 -
 53
53 -
 54
54 -
 55
55 -
 56
56 -
 57
57 -
 58
58 -
 59
59 -
 60
60 -
 61
61 -
 62
62 -
 63
63 -
 64
64 -
65
-
66
-
67
-
68
-
69
-
70
-
71
-
72
-
73
-
74
-
75
-
76
-
77
-
78
 |
 |

53
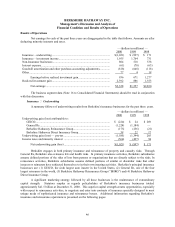
Insurance — Investment Income
Following is a summary of the net investment income of insurance operations for the past three years.
(dollars in millions)
2000 1999 1998
Investment income before taxes ........................................................................ $2,787 $2,482 $974
Applicable income taxes and minority interest .................................................. 832 718 243
Investment income after taxes and minority interest.......................................... $1,955 $1,764 $731
Investment income before taxes from the insurance operations increased in 2000 by $305 million (12.3%)
over 1999. The increase in investment income in 2000 as compared to 1999 is due to greater amounts of taxable
interest and dividend income, partially offset by reduced tax exempt interest. Approximately one-third of the total
increase in pre-tax investment income in 2000 was attributed to the inclusion of the fifth quarter of General Re’s
International property/casualty and Global life/health operations, as previously discussed. Investment income in
1999 includes income of General Re’s insurance operations, which were acquired by Berkshire in December 1998.
At December 31, 2000, cash and invested assets totaled approximately $76.5 billion, an increase of
approximately $4.1 billion from December 31, 1999. Insurance invested assets grew by about $25 billion in 1998
as a result of the General Re acquisition.
Berkshire’s insurance businesses generate large amounts of investment income derived from shareholder
capital, as well as policyholder float. Float represents an estimate of the amount of funds ultimately payable to
policyholders that is available for investment. Float denotes the sum of net loss and loss adjustment expense
reserves, unearned premiums, and funds held under reinsurance agreements, less premiums receivable, deferred
acquisition costs, deferred charges on retroactive reinsurance and prepaid income taxes. The aggregate float was
approximately $27.9 billion at December 31, 2000 and $25.3 billion at December 31, 1999. Most of the increase
in float during 2000 was generated by BHRG.
Income taxes and minority interest as a percentage of investment income before taxes were 29.9% for
2000, 28.9% for 1999 and 24.9% for 1998. The increase in the rates reflects an increase in the proportion of
taxable interest income relative to the amounts of dividend and tax exempt interest, which are effectively taxed at
lower rates.
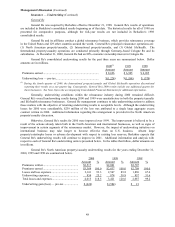
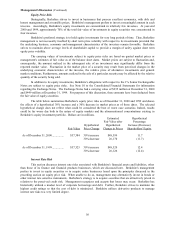
Non-Insurance Businesses
A summary follows of results from Berkshire’s non-insurance businesses for the past three years.
— (dollars in millions) —
2000 1999 1998
Amount %Amount %Amount %
Revenues ................................................................... $7,886 100 $6,042 100 $4,865 100
Cost and expenses...................................................... 6,595 84 5,205 86 4,005 82
Operating profit......................................................... 1,291 16 837 14 860 18
Income taxes and minority interest ............................ 487 6 319 5 322 7
Contribution to net earnings ...................................... $ 804 10 $ 518 9 $ 538 11
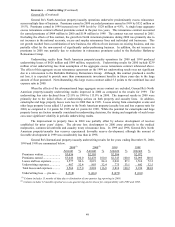
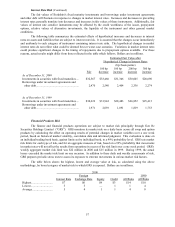
A comparison of revenues and operating profits between 2000, 1999 and 1998 for the non-insurance
businesses follows.
— (dollars in millions) — Operating Profit
Revenues Operating Profits as a % of Revenues
Non-Insurance Businesses 2000 1999 1998 2000 1999 1998 2000 1999 1998
Flight Services..................... 2,279 1,856 858 213 225 181 9 12 21
Retail businesses.................. 1,864 1,402 1,213 175 130 110 9 9 9
Scott Fetzer Companies ....... 963 1,021 1,002 122 147 137 13 14 14
Other businesses .................. 2,780 1,763 1,792 781 335 432 28 19 24
$7,886 $6,042 $4,865 $1,291 $837 $860