Avon 2015 Annual Report Download - page 89
Download and view the complete annual report
Please find page 89 of the 2015 Avon annual report below. You can navigate through the pages in the report by either clicking on the pages listed below, or by using the keyword search tool below to find specific information within the annual report.-
 1
1 -
2
-
3
-
4
-
5
-
6
-
7
-
8
-
9
-
10
-
11
-
12
-
13
-
14
-
15
-
16
-
17
-
18
-
19
-
20
-
21
-
22
-
23
-
24
-
25
-
26
-
27
-
28
-
29
-
30
-
31
-
32
-
33
-
34
-
35
-
36
-
37
-
38
-
39
-
40
-
41
-
42
-
43
-
44
-
45
-
46
-
47
-
48
-
49
-
50
-
51
-
52
-
53
-
54
-
55
-
56
-
57
-
58
-
59
-
60
-
61
-
62
-
63
-
64
-
65
-
66
-
67
-
68
-
69
-
70
-
71
-
72
-
73
-
74
-
75
-
76
-
77
-
78
-
 79
79 -
 80
80 -
 81
81 -
 82
82 -
 83
83 -
 84
84 -
 85
85 -
 86
86 -
 87
87 -
 88
88 -
 89
89 -
 90
90 -
 91
91 -
 92
92 -
 93
93 -
 94
94 -
 95
95 -
 96
96 -
 97
97 -
 98
98 -
 99
99 -
100
-
101
-
102
-
103
-
104
-
105
-
106
-
107
-
108
-
109
-
110
-
111
-
112
-
113
-
114
-
115
-
116
-
117
-
118
-
119
-
120
-
121
-
122
-
123
-
124
-
125
-
126
-
127
-
128
-
129
-
130
-
131
-
132
-
133
-
134
-
135
-
136
-
137
-
138
-
139
-
140
 |
 |

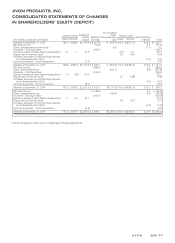
AVON PRODUCTS, INC.
CONSOLIDATED STATEMENTS OF CHANGES
IN SHAREHOLDERS’ EQUITY (DEFICIT)
(In millions, except per share data)
Common Stock Additional
Paid-In
Capital
Retained
Earnings
Accumulated
Other
Comprehensive
Loss
Treasury Stock Noncontrolling
Interests Total
Shares Amount Shares Amount
Balances at December 31, 2012 746.7 $188.3 $2,119.6 $ 4,357.8 $ (876.7) 314.5 $(4,571.9) $16.2 $ 1,233.3
Net (loss) income (56.4) 4.5 (51.9)
Other comprehensive income (loss) 6.3 (1.1) 5.2
Dividends – $0.24 per share (104.7) (104.7)
Exercise / vesting of share-based compensation 2.1 1.1 59.5 (0.1) 0.1 60.7
Repurchase of common stock 0.5 (9.4) (9.4)
Purchases and sales of noncontrolling interests,
net of dividends paid of $2.2 (2.2) (2.2)
Income tax expense – stock transactions (3.5) (3.5)
Balances at December 31, 2013 748.8 $189.4 $2,175.6 $ 4,196.7 $ (870.4) 314.9 $(4,581.2) $17.4 $ 1,127.5
Net (loss) income (388.6) 3.7 (384.9)
Other comprehensive loss (347.2) (0.6) (347.8)
Dividends – $0.24 per share (105.2) (105.2)
Exercise / vesting of share-based compensation 1.5 (1.8) 41.0 – – 39.2
Repurchase of common stock 0.7 (9.8) (9.8)
Purchases and sales of noncontrolling interests,
net of dividends paid of $5.0 (5.0) (5.0)
Income tax expense – stock transactions (8.7) (8.7)
Balances at December 31, 2014 750.3 $187.6 $2,207.9 $ 3,702.9 $(1,217.6) 315.6 $(4,591.0) $15.5 $ 305.3
Net (loss) income (1,148.9) 3.3 (1,145.6)
Other comprehensive loss (148.6) (2.0) (150.6)
Dividends – $0.24 per share (105.9) (105.9)
Exercise / vesting of share-based compensation 1.1 0.3 50.7 – – 51.0
Repurchase of common stock 0.3 (3.1) (3.1)
Purchases and sales of noncontrolling interests,
net of dividends paid of $2.9 (2.9) (2.9)
Income tax expense – stock transactions (4.6) (4.6)
Balances at December 31, 2015 751.4 $187.9 $2,254.0 $ 2,448.1 $(1,366.2) 315.9 $(4,594.1) $13.9 $(1,056.4)
The accompanying notes are an integral part of these statements.
A V O N 2015 F-7
7553_fin.pdf 79