Avon 2015 Annual Report Download - page 63
Download and view the complete annual report
Please find page 63 of the 2015 Avon annual report below. You can navigate through the pages in the report by either clicking on the pages listed below, or by using the keyword search tool below to find specific information within the annual report.-
 1
1 -
2
-
3
-
4
-
5
-
6
-
7
-
8
-
9
-
10
-
11
-
12
-
13
-
14
-
15
-
16
-
17
-
18
-
19
-
20
-
21
-
22
-
23
-
24
-
25
-
26
-
27
-
28
-
29
-
30
-
31
-
32
-
33
-
34
-
35
-
36
-
37
-
38
-
39
-
40
-
41
-
42
-
43
-
44
-
45
-
46
-
47
-
48
-
49
-
50
-
51
-
52
-
 53
53 -
 54
54 -
 55
55 -
 56
56 -
 57
57 -
 58
58 -
 59
59 -
 60
60 -
 61
61 -
 62
62 -
 63
63 -
 64
64 -
 65
65 -
 66
66 -
 67
67 -
 68
68 -
 69
69 -
 70
70 -
 71
71 -
 72
72 -
 73
73 -
74
-
75
-
76
-
77
-
78
-
79
-
80
-
81
-
82
-
83
-
84
-
85
-
86
-
87
-
88
-
89
-
90
-
91
-
92
-
93
-
94
-
95
-
96
-
97
-
98
-
99
-
100
-
101
-
102
-
103
-
104
-
105
-
106
-
107
-
108
-
109
-
110
-
111
-
112
-
113
-
114
-
115
-
116
-
117
-
118
-
119
-
120
-
121
-
122
-
123
-
124
-
125
-
126
-
127
-
128
-
129
-
130
-
131
-
132
-
133
-
134
-
135
-
136
-
137
-
138
-
139
-
140
 |
 |

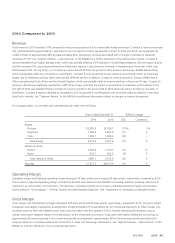
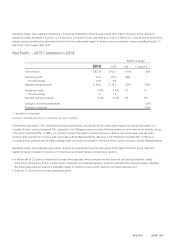
Venezuela’s average order benefited from the inflationary impact on pricing that was partially offset by a decrease in units sold. Venezuela’s
Active Representatives and units sold were negatively impacted by the reduced size of our product offering, primarily the result of our
increased difficulty to import products and raw materials. Additional information on our Venezuela operations is discussed in more detail
above.
Operating margin was negatively impacted by 2.2 points as compared to the prior-year period due to the Venezuelan special items in
conjunction with highly inflationary accounting as discussed further above. Operating margin was also negatively impacted by .4 points as
compared to the prior-year period from higher CTI restructuring. Adjusted operating margin decreased .6 points, or increased .1 points on a
Constant $ basis, primarily as a result of:
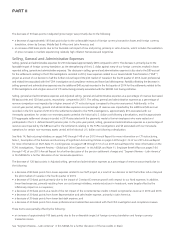
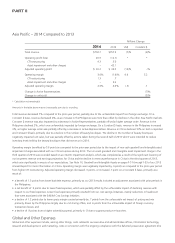
• a benefit of 1.1 points from lower Representative, sales leader and field expense, which was primarily attributable to a shift towards more
cost-effective incentives;
• a benefit of 1.0 point associated with the net impact of the incremental tax credits in Brazil recognized as revenue in 2014 and 2013,
discussed above;
• a benefit of .3 points from lower net brochure costs, driven by Venezuela as a result of cost savings initiatives;
• a decline of .8 points due to lower gross margin caused primarily by 1.4 points from the unfavorable impact of foreign currency
transaction losses, primarily in Venezuela, and .9 points from higher supply chain costs, which was driven by higher obsolescence primarily
in Venezuela and Brazil. These items were partially offset by 1.8 points from the favorable net impact of mix and pricing. Benefits from
pricing include the realization of price increases in markets experiencing relatively high inflation (Venezuela and Argentina) on inventory
acquired in advance of such inflation;
• a decline of .8 points from higher distribution expenses, driven by inflation in Venezuela and Argentina and other cost pressures in the
region; and
• a decline of .7 points from higher administrative expenses, partially driven by inflationary costs, and increased legal expenses associated
with labor and civil related matters in Brazil.
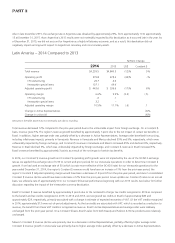
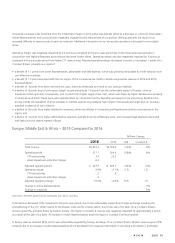
Europe, Middle East & Africa – 2015 Compared to 2014
%/Point Change
2015 2014 US$ Constant $
Total revenue $2,272.3 $2,705.8 (16)% 6%
Operating profit 217.1 300.9 (28)% 4%
CTI restructuring 3.5 23.2
Asset impairment and other charges 6.9 –
Adjusted operating profit $ 227.5 $ 324.1 (30)% (1)%
Operating margin 9.6% 11.1% (1.5) (.2)
CTI restructuring .2 .9
Asset impairment and other charges .3 –
Adjusted operating margin 10.0% 12.0% (2.0) (.7)
Change in Active Representatives 7%
Change in units sold 5%
Amounts in the table above may not necessarily sum due to rounding.
Total revenue decreased 16% compared to the prior-year period, due to the unfavorable impact from foreign exchange including the
strengthening of the U.S. dollar relative to the Russian ruble, and to a lesser extent, due to the sale of Liz Earle. On a Constant $ basis,
revenue grew 6%, primarily driven by Eastern Europe. The region’s Constant $ revenue was negatively impacted by approximately 2 points
as a result of the sale of Liz Earle. An increase in Active Representatives drove the region’s Constant $ revenue growth.
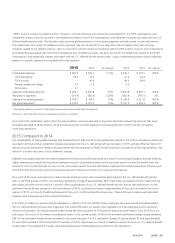
In Russia, revenue declined 23%, which was unfavorably impacted by foreign exchange. On a Constant $ basis, Russia’s revenue grew 23%,
primarily due to an increase in Active Representatives which benefited from sustained momentum in recruiting and retention, and higher
A V O N 2015 51
7553_fin.pdf 53