Avon 2015 Annual Report Download - page 46
Download and view the complete annual report
Please find page 46 of the 2015 Avon annual report below. You can navigate through the pages in the report by either clicking on the pages listed below, or by using the keyword search tool below to find specific information within the annual report.-
 1
1 -
2
-
3
-
4
-
5
-
6
-
7
-
8
-
9
-
10
-
11
-
12
-
13
-
14
-
15
-
16
-
17
-
18
-
19
-
20
-
21
-
22
-
23
-
24
-
25
-
26
-
27
-
28
-
29
-
30
-
31
-
32
-
33
-
34
-
35
-
 36
36 -
 37
37 -
 38
38 -
 39
39 -
 40
40 -
 41
41 -
 42
42 -
 43
43 -
 44
44 -
 45
45 -
 46
46 -
 47
47 -
 48
48 -
 49
49 -
 50
50 -
 51
51 -
 52
52 -
 53
53 -
 54
54 -
 55
55 -
 56
56 -
57
-
58
-
59
-
60
-
61
-
62
-
63
-
64
-
65
-
66
-
67
-
68
-
69
-
70
-
71
-
72
-
73
-
74
-
75
-
76
-
77
-
78
-
79
-
80
-
81
-
82
-
83
-
84
-
85
-
86
-
87
-
88
-
89
-
90
-
91
-
92
-
93
-
94
-
95
-
96
-
97
-
98
-
99
-
100
-
101
-
102
-
103
-
104
-
105
-
106
-
107
-
108
-
109
-
110
-
111
-
112
-
113
-
114
-
115
-
116
-
117
-
118
-
119
-
120
-
121
-
122
-
123
-
124
-
125
-
126
-
127
-
128
-
129
-
130
-
131
-
132
-
133
-
134
-
135
-
136
-
137
-
138
-
139
-
140
 |
 |

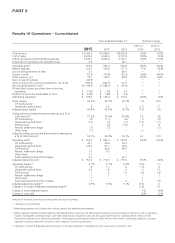
PART II
benefit pension and postretirement plans and approximately $238 for the non-U.S. defined benefit pension and postretirement plans that
have not yet been charged to expense, of which approximately $247 of the U.S. defined benefit pension and postretirement plans are
associated with discontinued operations. These actuarial losses have been charged to accumulated other comprehensive loss (“AOCI”)
within shareholders’ equity. While we believe that the assumptions used are reasonable, differences in actual experience or changes in
assumptions may materially affect our pension and postretirement obligations and future expense. For 2016, our assumption for the
expected rate of return on assets is 7.00% for our U.S. defined benefit pension plan and 6.40% for our non-U.S. defined benefit pension
plans. Our assumptions are reviewed and determined on an annual basis.
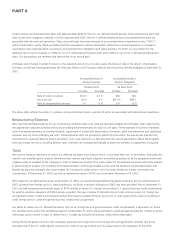
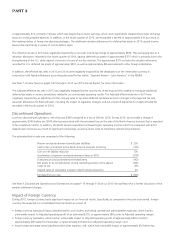
A 50 basis point change (in either direction) in the expected rate of return on plan assets, the discount rate or the rate of compensation
increases, would have had approximately the following effect on 2015 pension expense and the pension benefit obligation at December 31,
2015:
Increase/(Decrease) in
Pension Expense
Increase/(Decrease) in
Pension Obligation
50 Basis Point 50 Basis Point
Increase Decrease Increase Decrease
Rate of return on assets $(5.0) $ 5.0 N/A N/A
Discount rate (6.5) 6.4 $(91.0) $98.1
Rate of compensation increase 1.0 (1.0) 6.9 (6.7)
The above table reflects the entire U.S. pension and postretirement plans, a portion of which are associated with discontinued operations.
Restructuring Reserves
We record the estimated expense for our restructuring initiatives when such costs are deemed probable and estimable, when approved by
the appropriate corporate authority and by accumulating detailed estimates of costs for such plans. These expenses include the estimated
costs of employee severance and related benefits, impairment or accelerated depreciation of property, plant and equipment and capitalized
software, and any other qualifying exit costs. These estimated costs are grouped by specific projects within the overall plan and are then
monitored on a quarterly basis by finance personnel. Such costs represent our best estimate, but require assumptions about the programs
that may change over time, including attrition rates. Estimates are evaluated periodically to determine whether an adjustment is required.
Taxes
We record a valuation allowance to reduce our deferred tax assets to an amount that is “more likely than not” to be realized. Evaluating the
need for and quantifying the valuation allowance often requires significant judgment and extensive analysis of all the weighted positive and
negative evidence available to the Company in order to determine whether all or some portion of the deferred tax assets will not be realized.
In performing this analysis, the Company’s forecasted domestic and foreign taxable income, and the existence of potential prudent and
feasible tax planning strategies that would enable the Company to utilize some or all of its excess foreign tax credits, were taken into
consideration. At December 31, 2015, we had net deferred tax assets of $151 (net of valuation allowances of $1,972).
With respect to our deferred tax assets, at December 31, 2015, we had recognized deferred tax assets relating to tax loss carryforwards of
$657, primarily from foreign and U.S. state jurisdictions, for which a valuation allowance of $652 has been provided. Prior to December 31,
2015, we had recognized deferred tax assets of $746 relating to excess U.S. foreign tax and other U.S. general business credit carryforwards
for which a valuation allowance of $746 has been provided. We have a history of domestic source losses, and our excess U.S. foreign tax
and general business credits have primarily resulted from having a greater domestic source loss in recent years which reduces our ability to
credit foreign taxes or utilize the general business credits which we generate.
Our ability to realize our U.S. deferred tax assets, such as our foreign tax and general business credit carryforwards, is dependent on future
U.S. taxable income within the carryforward period. At December 31, 2015, we would need to generate approximately $2.1 billion of excess
net foreign source income in order to realize the U.S. foreign tax and general business credits before they expire.
During the fourth quarter of 2014, the Company’s expected net foreign source income was reduced significantly, primarily due to the
strengthening of the U.S. dollar against currencies for some of our key markets and, to a lesser extent, the finalization of the FCPA
7553_fin.pdf 36