Avon 2015 Annual Report Download - page 50
Download and view the complete annual report
Please find page 50 of the 2015 Avon annual report below. You can navigate through the pages in the report by either clicking on the pages listed below, or by using the keyword search tool below to find specific information within the annual report.-
 1
1 -
2
-
3
-
4
-
5
-
6
-
7
-
8
-
9
-
10
-
11
-
12
-
13
-
14
-
15
-
16
-
17
-
18
-
19
-
20
-
21
-
22
-
23
-
24
-
25
-
26
-
27
-
28
-
29
-
30
-
31
-
32
-
33
-
34
-
35
-
36
-
37
-
38
-
39
-
 40
40 -
 41
41 -
 42
42 -
 43
43 -
 44
44 -
 45
45 -
 46
46 -
 47
47 -
 48
48 -
 49
49 -
 50
50 -
 51
51 -
 52
52 -
 53
53 -
 54
54 -
 55
55 -
 56
56 -
 57
57 -
 58
58 -
 59
59 -
 60
60 -
61
-
62
-
63
-
64
-
65
-
66
-
67
-
68
-
69
-
70
-
71
-
72
-
73
-
74
-
75
-
76
-
77
-
78
-
79
-
80
-
81
-
82
-
83
-
84
-
85
-
86
-
87
-
88
-
89
-
90
-
91
-
92
-
93
-
94
-
95
-
96
-
97
-
98
-
99
-
100
-
101
-
102
-
103
-
104
-
105
-
106
-
107
-
108
-
109
-
110
-
111
-
112
-
113
-
114
-
115
-
116
-
117
-
118
-
119
-
120
-
121
-
122
-
123
-
124
-
125
-
126
-
127
-
128
-
129
-
130
-
131
-
132
-
133
-
134
-
135
-
136
-
137
-
138
-
139
-
140
 |
 |

PART II
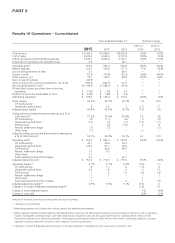
Results Of Operations – Consolidated
Years ended December 31 %/Point Change
2015 2014 2013
2015 vs.
2014
2014 vs.
2013
Total revenue $ 6,160.5 $7,648.0 $8,496.8 (19)% (10)%
Cost of sales 2,445.4 3,006.9 3,172.8 (19)% (5)%
Selling, general and administrative expenses 3,543.2 4,206.8 4,742.1 (16)% (11)%
Impairment of goodwill and intangible assets 6.9 – 42.1 * *
Operating profit 165.0 434.3 539.8 (62)% (20)%
Interest expense 120.5 108.8 117.9 11% (8)%
Loss on extinguishment of debt 5.5 – 86.0 * *
Interest income (12.5) (14.8) (25.9) (16)% (43)%
Other expense, net 73.7 139.5 83.9 (47)% 66%
Gain on sale of business (44.9) – – * *
(Loss) income from continuing operations, net of tax (796.5) (344.5) 67.5 * *
Net loss attributable to Avon $(1,148.9) $ (388.6) $ (56.4) * *
Diluted (loss) income per share from continuing
operations $ (1.81) $ (.79) $ .14 * *
Diluted loss per share attributable to Avon $ (2.60) $ (.88) $ (.13) * *
Advertising expenses(1) $ 128.0 $ 166.4 $ 174.3 (23)% (5)%
Gross margin 60.3% 60.7% 62.7% (.4) (2.0)
CTI restructuring – – – – –
Venezuelan special items .5 1.6 .5 (1.1) 1.1
Adjusted gross margin 60.8% 62.3% 63.2% (1.5) (.9)
Selling, general and administrative expenses as a % of
total revenue(2) 57.5% 55.0% 55.8% 2.5 (.8)
CTI restructuring (.8) (1.1) (.6) .3 (.5)
Venezuelan special items (1.5) (.2) (.1) (1.3) (.1)
FCPA accrual – (.6) (1.0) .6 .4
Pension settlement charge (.1) (.1) – – (.1)
Other items (.1) – – (.1) –
Adjusted selling, general and administrative expenses as
a % of total revenue(2) 55.1% 52.9% 54.1% 2.2 (1.2)
Operating profit $ 165.0 $ 434.3 $ 539.8 (62)% (20)%
CTI restructuring 49.1 86.6 53.4
Venezuelan special items 120.2 137.1 49.6
FCPA accrual – 46.0 89.0
Pension settlement charge 7.3 9.5 –
Other items 3.1 – –
Asset impairment and other charges 6.9 – 42.1
Adjusted operating profit $ 351.6 $ 713.5 $ 773.9 (51)% (8)%
Operating margin(2) 2.7% 5.7% 6.4% (3.0) (.7)
CTI restructuring .8 1.1 .6 (.3) .5
Venezuelan special items 2.0 1.8 .6 .2 1.2
FCPA accrual – .6 1.0 (.6) (.4)
Pension settlement charge .1 .1 – – .1
Other items .1 – – .1 –
Asset impairment and other charges .1 – .5 .1 (.5)
Adjusted operating margin(2) 5.7% 9.3% 9.1% (3.6) .2
Change in Constant $ Adjusted operating margin(3) (1.8) 1.0
Change in Active Representatives 1% (4)%
Change in units sold (2)% (2)%
Amounts in the table above may not necessarily sum due to rounding.
* Calculation not meaningful
(1) Advertising expenses are included within selling, general and administrative expenses.
(2) Selling, general and administrative expenses and Adjusted selling, general, and administrative expenses as a percentage of revenue, as well as operating
margin and Adjusted operating margin, have been impacted as compared to amounts previously reported due to classifying North America within
discontinued operations for all periods presented. Global expenses previously allocated to North America will remain in continuing operations, as these
represent costs associated with functions of the Company’s continuing operations.
(3) Change in Constant $ Adjusted operating margin for all years presented is calculated using the current-year Constant $ rates.
7553_fin.pdf 40