Avon 2015 Annual Report Download - page 58
Download and view the complete annual report
Please find page 58 of the 2015 Avon annual report below. You can navigate through the pages in the report by either clicking on the pages listed below, or by using the keyword search tool below to find specific information within the annual report.-
 1
1 -
2
-
3
-
4
-
5
-
6
-
7
-
8
-
9
-
10
-
11
-
12
-
13
-
14
-
15
-
16
-
17
-
18
-
19
-
20
-
21
-
22
-
23
-
24
-
25
-
26
-
27
-
28
-
29
-
30
-
31
-
32
-
33
-
34
-
35
-
36
-
37
-
38
-
39
-
40
-
41
-
42
-
43
-
44
-
45
-
46
-
47
-
 48
48 -
 49
49 -
 50
50 -
 51
51 -
 52
52 -
 53
53 -
 54
54 -
 55
55 -
 56
56 -
 57
57 -
 58
58 -
 59
59 -
 60
60 -
 61
61 -
 62
62 -
 63
63 -
 64
64 -
 65
65 -
 66
66 -
 67
67 -
 68
68 -
69
-
70
-
71
-
72
-
73
-
74
-
75
-
76
-
77
-
78
-
79
-
80
-
81
-
82
-
83
-
84
-
85
-
86
-
87
-
88
-
89
-
90
-
91
-
92
-
93
-
94
-
95
-
96
-
97
-
98
-
99
-
100
-
101
-
102
-
103
-
104
-
105
-
106
-
107
-
108
-
109
-
110
-
111
-
112
-
113
-
114
-
115
-
116
-
117
-
118
-
119
-
120
-
121
-
122
-
123
-
124
-
125
-
126
-
127
-
128
-
129
-
130
-
131
-
132
-
133
-
134
-
135
-
136
-
137
-
138
-
139
-
140
 |
 |

PART II
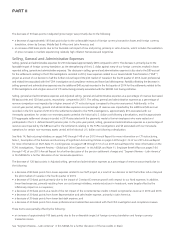
See Note 3, Discontinued Operations and Divestitures on pages F-15 through F-18 and “Segment Review – Global and Other Expenses” in
this MD&A and Note 11, Employee Benefit Plans on pages F-34 through F-42 of our 2015 Annual Report for a further discussion of the
pension settlement charges.
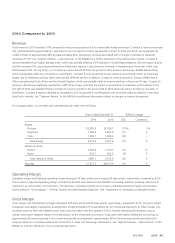
Other Comprehensive Income (Loss)
Other comprehensive income (loss), net of taxes was approximately ($151) in 2015 compared with approximately ($348) in 2014, primarily
due to net actuarial gains of approximately $41 in 2015 as compared with net actuarial losses of approximately $187 in 2014. In 2015, net
actuarial gains benefited from higher discount rates for the non-U.S. and U.S. pension plans, partially offset by lower asset returns in the
non-U.S. and U.S. pension plans in 2015 as compared to 2014. The other comprehensive income (loss) year-over-year comparison was also
unfavorably impacted by foreign currency translation adjustments, which increased by approximately $27 as compared to 2014 primarily due
to unfavorable movements of the Brazilian real, partially offset by the year-over-year comparison of movements of the Polish zloty and
Russian ruble.
Other comprehensive income (loss), net of taxes was approximately ($348) in 2014 compared with approximately $5 in 2013, primarily due
to net actuarial losses of approximately $187 in 2014 as compared with net actuarial gains of approximately $81 in 2013. In 2014, net
actuarial losses were negatively impacted by lower discount rates for the non-U.S. and U.S. pension plans and updated mortality rates for
the U.S. pension plan, partially offset by higher asset returns in the non-U.S. and U.S. pension plans in 2014 as compared to 2013. The other
comprehensive income (loss) year-over-year comparison was also unfavorably impacted by foreign currency translation adjustments, as well
as higher amortization of net actuarial loss which was driven by the settlement charges associated with the U.S. pension plan. In 2014,
foreign currency translation adjustments were negatively impacted by approximately $136 as compared to 2013 primarily due to
unfavorable movements of the Polish zloty, the British pound, the Colombian peso and the Mexican peso.
See Note 11, Employee Benefit Plans on pages F-34 through F-42 of our 2015 Annual Report for more information.
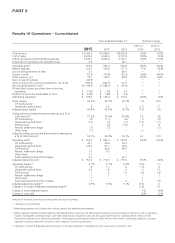
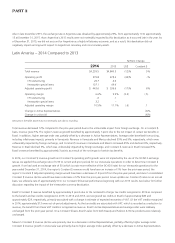
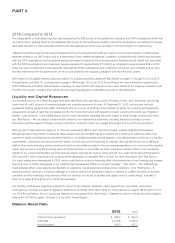
Segment Review
Below is an analysis of the key factors affecting revenue and operating profit (loss) by reportable segment for each of the years in the three-
year period ended December 31, 2015:
Years ended December 31 2015 2014 2013
Total
Revenue
Operating
Profit (Loss)
Total
Revenue
Operating
Profit (Loss)
Total
Revenue
Operating
Profit (Loss)
Latin America $3,260.4 $ 103.1 $4,239.5 $ 279.8 $4,840.5 $478.6
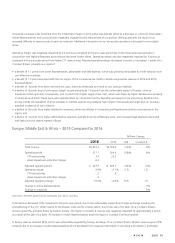
Europe, Middle East & Africa 2,272.3 217.1 2,705.8 300.9 2,898.4 406.7
Asia Pacific 627.8 35.3 702.7 20.9 757.9 (12.1)
Total from operations 6,160.5 355.5 7,648.0 601.6 8,496.8 873.2
Global and other expenses – (190.5) – (167.3) – (333.4)
Total $6,160.5 $ 165.0 $7,648.0 $ 434.3 $8,496.8 $539.8
7553_fin.pdf 48