Avon 2015 Annual Report Download - page 120
Download and view the complete annual report
Please find page 120 of the 2015 Avon annual report below. You can navigate through the pages in the report by either clicking on the pages listed below, or by using the keyword search tool below to find specific information within the annual report.-
 1
1 -
2
-
3
-
4
-
5
-
6
-
7
-
8
-
9
-
10
-
11
-
12
-
13
-
14
-
15
-
16
-
17
-
18
-
19
-
20
-
21
-
22
-
23
-
24
-
25
-
26
-
27
-
28
-
29
-
30
-
31
-
32
-
33
-
34
-
35
-
36
-
37
-
38
-
39
-
40
-
41
-
42
-
43
-
44
-
45
-
46
-
47
-
48
-
49
-
50
-
51
-
52
-
53
-
54
-
55
-
56
-
57
-
58
-
59
-
60
-
61
-
62
-
63
-
64
-
65
-
66
-
67
-
68
-
69
-
70
-
71
-
72
-
73
-
74
-
75
-
76
-
77
-
78
-
79
-
80
-
81
-
82
-
83
-
84
-
85
-
86
-
87
-
88
-
89
-
90
-
91
-
92
-
93
-
94
-
95
-
96
-
97
-
98
-
99
-
100
-
101
-
102
-
103
-
104
-
105
-
106
-
107
-
108
-
109
-
 110
110 -
 111
111 -
 112
112 -
 113
113 -
 114
114 -
 115
115 -
 116
116 -
 117
117 -
 118
118 -
 119
119 -
 120
120 -
 121
121 -
 122
122 -
 123
123 -
 124
124 -
 125
125 -
 126
126 -
 127
127 -
 128
128 -
 129
129 -
 130
130 -
131
-
132
-
133
-
134
-
135
-
136
-
137
-
138
-
139
-
140
 |
 |

NOTES TO CONSOLIDATED FINANCIAL STATEMENTS
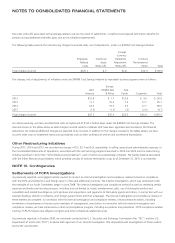
assets annually and adjust as necessary. In determining the net cost for the year ended December 31, 2015, the assumed rate of return on
assets globally was 6.87%, which represents the weighted-average rate of return on all plan assets, including the U.S. and non-U.S. defined
benefit pension plans. Amounts associated with the pension and postretirement benefit plans in Canada and the postretirement benefit plan
in Puerto Rico, which are associated with discontinued operations, have been excluded from all amounts.
The assumed rate of return for determining 2015 net costs for the U.S. defined benefit pension plan was 7.25%. In addition, the current
rate of return assumption for the U.S. defined benefit pension plan was based on an asset allocation of approximately 70% in corporate and
government bonds and mortgage-backed securities (which are expected to earn approximately 3% to 5% in the long term) and
approximately 30% in equity securities and high yield securities (which are expected to earn approximately 5% to 7% in the long term). In
addition to the physical assets, the asset portfolio has derivative instruments which increase our exposure to higher yielding securities. Similar
assessments were performed in determining rates of return on non-U.S. defined benefit pension plan assets, to arrive at our weighted-
average assumed rate of return of 6.55% for determining 2015 net cost.
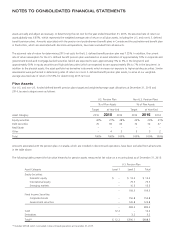
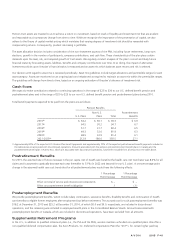
Plan Assets
Our U.S. and non-U.S. funded defined benefit pension plans target and weighted-average asset allocations at December 31, 2015 and
2014, by asset category were as follows:
U.S. Pension Plan Non-U.S. Pension Plans
% of Plan Assets % of Plan Assets
Target at Year-End Target at Year-End
Asset Category 2016 2015 2014 2016 2015 2014
Equity securities 30% 27% 28% 23% 23% 61%
Debt securities 70 69 69 72 72 37
Real Estate – – – – – –
Other – 4 3 5 5 2
Total 100% 100% 100% 100% 100% 100%
Amounts associated with the pension plan in Canada, which are included in discontinued operations, have been excluded from all amounts
in the table above.
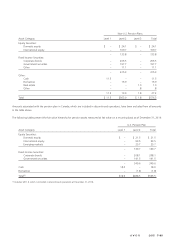
The following tables present the fair value hierarchy for pension assets measured at fair value on a recurring basis as of December 31, 2015:
U.S. Pension Plan
Asset Category Level 1 Level 2 Total
Equity Securities:
Domestic equity $ – $ 13.3 $ 13.3
International equity – 79.5 79.5
Emerging markets – 16.5 16.5
– 109.3 109.3
Fixed Income Securities:
Corporate bonds – 156.8 156.8
Government securities – 126.8 126.8
– 283.6 283.6
Cash 12.2 – 12.2
Derivatives – 3.2 3.2
Total(4) $ 12.2 $396.1 $408.3
(4) Includes $374.8 which is included in discontinued operations at December 31, 2015.
7553_fin.pdf 110