Avon 2015 Annual Report Download - page 40
Download and view the complete annual report
Please find page 40 of the 2015 Avon annual report below. You can navigate through the pages in the report by either clicking on the pages listed below, or by using the keyword search tool below to find specific information within the annual report.-
 1
1 -
2
-
3
-
4
-
5
-
6
-
7
-
8
-
9
-
10
-
11
-
12
-
13
-
14
-
15
-
16
-
17
-
18
-
19
-
20
-
21
-
22
-
23
-
24
-
25
-
26
-
27
-
28
-
29
-
 30
30 -
 31
31 -
 32
32 -
 33
33 -
 34
34 -
 35
35 -
 36
36 -
 37
37 -
 38
38 -
 39
39 -
 40
40 -
 41
41 -
 42
42 -
 43
43 -
 44
44 -
 45
45 -
 46
46 -
 47
47 -
 48
48 -
 49
49 -
 50
50 -
51
-
52
-
53
-
54
-
55
-
56
-
57
-
58
-
59
-
60
-
61
-
62
-
63
-
64
-
65
-
66
-
67
-
68
-
69
-
70
-
71
-
72
-
73
-
74
-
75
-
76
-
77
-
78
-
79
-
80
-
81
-
82
-
83
-
84
-
85
-
86
-
87
-
88
-
89
-
90
-
91
-
92
-
93
-
94
-
95
-
96
-
97
-
98
-
99
-
100
-
101
-
102
-
103
-
104
-
105
-
106
-
107
-
108
-
109
-
110
-
111
-
112
-
113
-
114
-
115
-
116
-
117
-
118
-
119
-
120
-
121
-
122
-
123
-
124
-
125
-
126
-
127
-
128
-
129
-
130
-
131
-
132
-
133
-
134
-
135
-
136
-
137
-
138
-
139
-
140
 |
 |
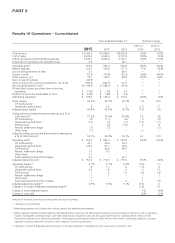
PART II
distributed our products in 27 other countries and territories. Our reportable segments are based on geographic operations and include
commercial business units in Latin America; Europe, Middle East & Africa; and Asia Pacific. In addition, we operate our business in North
America, which has been presented as discontinued operations for all periods presented and is discussed further below. Our product
categories are Beauty and Fashion & Home. Beauty consists of skincare (which includes personal care), fragrance and color (cosmetics).
Fashion & Home consists of fashion jewelry, watches, apparel, footwear, accessories, gift and decorative products, housewares,
entertainment and leisure products, children’s products and nutritional products. Sales are made to the ultimate consumer principally
through direct selling by Representatives, who are independent contractors and not our employees. As of December 31, 2015, we had
nearly 6 million active Representatives which represents the number of Representatives submitting an order in a sales campaign, totaled for
all campaigns during the year and then divided by the number of campaigns. The success of our business is highly dependent on recruiting,
retaining and servicing our Representatives. During 2015, all of our consolidated revenue was derived from operations outside of the U.S.
In December 2015, we entered into definitive agreements with affiliates of Cerberus Capital Management (“Cerberus”), which include a
$435 investment in Avon by an affiliate of Cerberus through the purchase of our convertible preferred stock and the separation of the North
America business from Avon into a privately-held company, which will include a $100 contribution by Avon, that will be majority-owned and
managed by an affiliate of Cerberus. Avon will retain approximately 20% ownership in this new privately-held company. These transactions
are expected to close concurrently in the first half of 2016. The North America business, which represents the Company’s operations in the
United States, Canada and Puerto Rico, was previously its own reportable segment and has been presented as discontinued operations for
all periods presented. Refer to Note 3, Discontinued Operations and Divestitures, on pages F-15 through F-18 of our 2015 Annual Report,
for additional information regarding the investment by an affiliate of Cerberus and the separation of the North America business.
Total revenue in 2015 compared to 2014 declined 19% compared to the prior-year period, due to unfavorable foreign exchange. Constant
$ revenue increased 2%. Constant $ revenue was negatively impacted by approximately 2 points due to taxes in Brazil from the combined
impact of the recognition of Value Added Tax (“VAT”) credits in 2014 which did not recur in 2015 along with a new Industrial Productions
Tax (“IPI”) on cosmetics which went into effect in May 2015. Constant $ revenue was also negatively impacted by approximately 1 point as
a result of the sale of Liz Earle which was completed in July 2015. Sales from the Beauty category decreased 20%, or increased 3% on a
Constant $ basis. Sales from the Fashion & Home category decreased 15%, or increased 5% on a Constant $ basis.
Our Constant $ revenue benefited from growth in markets experiencing relatively high inflation (Venezuela and Argentina), which
contributed approximately 2 points to our Constant $ revenue growth. Our Constant $ revenue also benefited from growth in Europe,
Middle East & Africa, most significantly Eastern Europe (Russia and Ukraine), and to a lesser extent, South Africa and underlying growth in
Brazil. Constant $ revenue benefited from higher average order and a 1% increase in Active Representatives. The increase in Active
Representatives was primarily due to growth in Europe, Middle East & Africa, most significantly Russia, which was primarily due to sustained
momentum in recruitment and retention, partially offset by markets experiencing relatively high inflation (Venezuela and Argentina). The net
impact of price and mix increased 4%, driven by increases in all regions. The net impact of price and mix was primarily positively impacted by
markets experiencing relatively high inflation (Venezuela and Argentina), as these markets benefited from the inflationary impact on pricing.
Units sold decreased 2%, primarily due to declines in units sold in Brazil and Venezuela, partially offset by an increase in units sold in Russia.
See “Segment Review” of this MD&A for additional information related to changes in revenue by segment.
Over the last two years, our profitability has suffered significantly given our geographic footprint and the strength of the U.S. dollar relative
to currencies of key Avon markets. As a result, our revenue and profits have been reduced when translated into U.S. dollars and our margins
have been negatively impacted by country mix, as certain of our markets which have historically had higher operating margins experienced
significant devaluation of their local currency. In addition, as our sales and costs are often denominated in different currencies, this has
created a negative foreign currency transaction impact. Specifically, as compared to the prior-year period, foreign currency has impacted our
consolidated financial results as a result of foreign currency transaction losses (classified within cost of sales, and selling, general and
administrative expenses), which had an unfavorable impact to Adjusted operating profit of an estimated $210, foreign currency translation,
which had an unfavorable impact to Adjusted operating profit of approximately $265 (of which approximately $90 related to Venezuela, as
discussed further below), and lower foreign exchange losses on our working capital (classified within other expense, net), which had a
favorable impact of approximately $10 before tax.
In November 2015, we announced an internal reorganization of our management structure, including the combined management of Latin
America and Europe, Middle East & Africa, effective January 1, 2016. As a result of the internal reorganization, we will report results for the
following four reportable segments beginning in the first quarter of 2016: Europe, Middle East & Africa; Northern Latin America; South
America; and Asia Pacific.
7553_fin.pdf 30