Avon 2015 Annual Report Download - page 126
Download and view the complete annual report
Please find page 126 of the 2015 Avon annual report below. You can navigate through the pages in the report by either clicking on the pages listed below, or by using the keyword search tool below to find specific information within the annual report.-
 1
1 -
2
-
3
-
4
-
5
-
6
-
7
-
8
-
9
-
10
-
11
-
12
-
13
-
14
-
15
-
16
-
17
-
18
-
19
-
20
-
21
-
22
-
23
-
24
-
25
-
26
-
27
-
28
-
29
-
30
-
31
-
32
-
33
-
34
-
35
-
36
-
37
-
38
-
39
-
40
-
41
-
42
-
43
-
44
-
45
-
46
-
47
-
48
-
49
-
50
-
51
-
52
-
53
-
54
-
55
-
56
-
57
-
58
-
59
-
60
-
61
-
62
-
63
-
64
-
65
-
66
-
67
-
68
-
69
-
70
-
71
-
72
-
73
-
74
-
75
-
76
-
77
-
78
-
79
-
80
-
81
-
82
-
83
-
84
-
85
-
86
-
87
-
88
-
89
-
90
-
91
-
92
-
93
-
94
-
95
-
96
-
97
-
98
-
99
-
100
-
101
-
102
-
103
-
104
-
105
-
106
-
107
-
108
-
109
-
110
-
111
-
112
-
113
-
114
-
115
-
 116
116 -
 117
117 -
 118
118 -
 119
119 -
 120
120 -
 121
121 -
 122
122 -
 123
123 -
 124
124 -
 125
125 -
 126
126 -
 127
127 -
 128
128 -
 129
129 -
 130
130 -
 131
131 -
 132
132 -
 133
133 -
 134
134 -
 135
135 -
 136
136 -
137
-
138
-
139
-
140
 |
 |

NOTES TO CONSOLIDATED FINANCIAL STATEMENTS
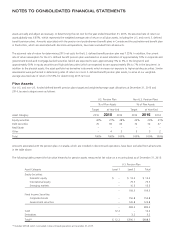
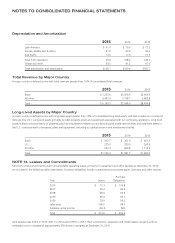
Depreciation and Amortization
2015 2014 2013
Latin America $ 51.0 $ 70.9 $ 72.2
Europe, Middle East & Africa 31.0 40.0 46.6
Asia Pacific 13.6 17.3 21.9
Total from operations 95.6 128.2 140.7
Global and other 30.5 41.2 47.0
Total depreciation and amortization $126.1 $169.4 $187.7
Total Revenue by Major Country
A major country is defined as one with total revenues greater than 10% of consolidated total revenues.
2015 2014 2013
Brazil $ 1,252.6 $1,909.3 $2,014.0
All other 4,907.9 5,738.7 6,482.8
Total $ 6,160.5 $7,648.0 $8,496.8
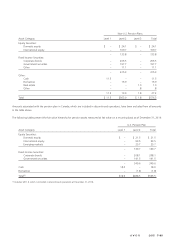
Long-Lived Assets by Major Country
A major country is defined as one with long-lived assets greater than 10% of consolidated long-lived assets, and also includes our country of
domicile (the U.S.). Long-lived assets primarily includes property, plant and equipment associated with our continuing operations. Long-lived
assets in Brazil consist primarily of property, plant and equipment related to manufacturing and distribution facilities and long-lived assets in
the U.S. consist primarily of property, plant and equipment, including our global research and development facility.
2015 2014 2013
Brazil $ 302.7 $ 361.9 $ 421.5
U.S. 225.9 250.0 265.6
All other 597.3 969.8 1,112.9
Total $1,125.9 $1,581.7 $1,800.0
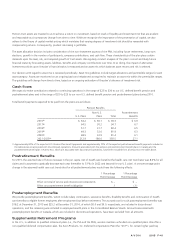
NOTE 13. Leases and Commitments
Minimum rental commitments under noncancellable operating leases, primarily for equipment and office facilities at December 31, 2015,
are included in the following table under leases. Purchase obligations include commitments to purchase paper, inventory and other services.
Year Leases
Purchase
Obligations
2016 $ 72.3 $ 143.8
2017 55.3 96.2
2018 45.3 63.0
2019 39.3 53.7
2020 33.9 50.2
Later years 100.2 49.3
Sublease rental income (33.3) N/A
Total $ 313.0 $ 456.2
Rent expense was $74.4 in 2015, $90.7 in 2014 and $109.6 in 2013. Plant construction, expansion and modernization projects with an
estimated cost to complete of approximately $39.9 were in progress at December 31, 2015.
7553_fin.pdf 116