Avon 2015 Annual Report Download - page 62
Download and view the complete annual report
Please find page 62 of the 2015 Avon annual report below. You can navigate through the pages in the report by either clicking on the pages listed below, or by using the keyword search tool below to find specific information within the annual report.-
 1
1 -
2
-
3
-
4
-
5
-
6
-
7
-
8
-
9
-
10
-
11
-
12
-
13
-
14
-
15
-
16
-
17
-
18
-
19
-
20
-
21
-
22
-
23
-
24
-
25
-
26
-
27
-
28
-
29
-
30
-
31
-
32
-
33
-
34
-
35
-
36
-
37
-
38
-
39
-
40
-
41
-
42
-
43
-
44
-
45
-
46
-
47
-
48
-
49
-
50
-
51
-
 52
52 -
 53
53 -
 54
54 -
 55
55 -
 56
56 -
 57
57 -
 58
58 -
 59
59 -
 60
60 -
 61
61 -
 62
62 -
 63
63 -
 64
64 -
 65
65 -
 66
66 -
 67
67 -
 68
68 -
 69
69 -
 70
70 -
 71
71 -
 72
72 -
73
-
74
-
75
-
76
-
77
-
78
-
79
-
80
-
81
-
82
-
83
-
84
-
85
-
86
-
87
-
88
-
89
-
90
-
91
-
92
-
93
-
94
-
95
-
96
-
97
-
98
-
99
-
100
-
101
-
102
-
103
-
104
-
105
-
106
-
107
-
108
-
109
-
110
-
111
-
112
-
113
-
114
-
115
-
116
-
117
-
118
-
119
-
120
-
121
-
122
-
123
-
124
-
125
-
126
-
127
-
128
-
129
-
130
-
131
-
132
-
133
-
134
-
135
-
136
-
137
-
138
-
139
-
140
 |
 |

PART II
Also in late December 2015, the exchange rate in Argentina was devalued by approximately 25%, from approximately 10 to approximately
13 at December 31, 2015. Avon Argentina’s 2015 results were not materially impacted by this devaluation as it occurred late in the year. As
of December 31, 2015, we did not account for Argentina as a highly inflationary economy, and as a result, this devaluation did not
negatively impact earnings with respect to Argentina’s monetary and non-monetary assets.
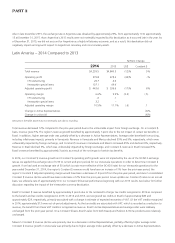
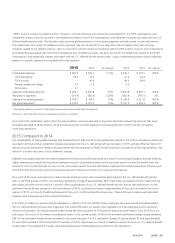
Latin America – 2014 Compared to 2013
%/Point Change
2014 2013 US$ Constant $
Total revenue $4,239.5 $4,840.5 (12)% 5%
Operating profit 279.8 478.6 (42)% –%
CTI restructuring 26.7 8.4
Venezuelan special items 137.1 49.6
Adjusted operating profit $ 443.6 $ 536.6 (17)% 6%
Operating margin 6.6% 9.9% (3.3) (.5)
CTI restructuring .6 .1
Venezuelan special items 3.2 –
Adjusted operating margin 10.5% 11.1% (.6) .1
Change in Active Representatives (4)%
Change in units sold (4)%
Amounts in the table above may not necessarily sum due to rounding.
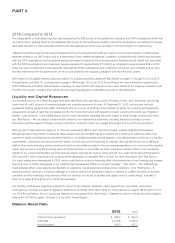
Total revenue decreased 12% compared to the prior-year period due to the unfavorable impact from foreign exchange. On a Constant $
basis, revenue grew 5%. The region’s revenue growth benefited by approximately 1 point due to the net impact of certain tax benefits in
Brazil. In addition, higher average order was partially offset by a decrease in Active Representatives. Average order benefited from pricing,
including inflationary impacts, primarily in Venezuela. Revenue in Venezuela and Mexico declined 55% and 9%, respectively, which were
unfavorably impacted by foreign exchange, and Constant $ revenue in Venezuela and Mexico increased 45% and declined 6%, respectively.
Revenue in Brazil declined 5%, which was unfavorably impacted by foreign exchange, and Constant $ revenue in Brazil increased 3%.
Brazil’s revenue benefited by approximately 3 points as a result of the net impact of certain tax benefits.
In 2014, our Constant $ revenue growth and Constant $ operating profit growth were not impacted by the use of the SICAD II exchange
rate as we applied the exchange rate of 6.30 to current and prior periods for our Venezuela operations in order to determine Constant $
growth. If we had used an exchange rate of 50 (which is a rate more reflective of the SICAD II rate) for our Venezuela operations for the
year ended December 31, 2014, the region’s Constant $ revenue would have been an increase of 1% from the prior-year period, the
region’s Constant $ Adjusted operating margin would have been a decrease of .8 points from the prior-year period, and Avon’s consolidated
Constant $ revenue decline would have been a decrease of 2% from the prior-year period. As we update our Constant $ rates on an annual
basis, we utilized a rate of approximately 50 in our Constant $ financial performance beginning with our 2015 results. See below for further
discussion regarding the impact of the Venezuelan currency devaluation.
Brazil’s Constant $ revenue benefited by approximately 3 points due to the net benefit of larger tax credits recognized in 2014 as compared
to the benefit and tax credits recognized in 2013. In 2014 and 2013, we recognized tax credits in Brazil of approximately $85 and
approximately $29, respectively, primarily associated with a change in estimate of expected recoveries of VAT. Of the VAT credits recognized
in 2014, approximately $13 were out-of-period adjustments. As the tax credits are associated with VAT, which is recorded as a reduction to
revenue, the benefit from these VAT credits is recognized as revenue. Brazil’s Active Representatives and average order were relatively
unchanged from the prior-year period. On a Constant $ basis, Brazil’s sales from both Beauty and Fashion & Home products were relatively
unchanged.
Mexico’s Constant $ revenue decline was primarily due to a decrease in Active Representatives, partially offset by higher average order.
Constant $ revenue growth in Venezuela was primarily due to higher average order, partially offset by a decrease in Active Representatives.
7553_fin.pdf 52