Avon 2015 Annual Report Download - page 121
Download and view the complete annual report
Please find page 121 of the 2015 Avon annual report below. You can navigate through the pages in the report by either clicking on the pages listed below, or by using the keyword search tool below to find specific information within the annual report.-
 1
1 -
2
-
3
-
4
-
5
-
6
-
7
-
8
-
9
-
10
-
11
-
12
-
13
-
14
-
15
-
16
-
17
-
18
-
19
-
20
-
21
-
22
-
23
-
24
-
25
-
26
-
27
-
28
-
29
-
30
-
31
-
32
-
33
-
34
-
35
-
36
-
37
-
38
-
39
-
40
-
41
-
42
-
43
-
44
-
45
-
46
-
47
-
48
-
49
-
50
-
51
-
52
-
53
-
54
-
55
-
56
-
57
-
58
-
59
-
60
-
61
-
62
-
63
-
64
-
65
-
66
-
67
-
68
-
69
-
70
-
71
-
72
-
73
-
74
-
75
-
76
-
77
-
78
-
79
-
80
-
81
-
82
-
83
-
84
-
85
-
86
-
87
-
88
-
89
-
90
-
91
-
92
-
93
-
94
-
95
-
96
-
97
-
98
-
99
-
100
-
101
-
102
-
103
-
104
-
105
-
106
-
107
-
108
-
109
-
110
-
 111
111 -
 112
112 -
 113
113 -
 114
114 -
 115
115 -
 116
116 -
 117
117 -
 118
118 -
 119
119 -
 120
120 -
 121
121 -
 122
122 -
 123
123 -
 124
124 -
 125
125 -
 126
126 -
 127
127 -
 128
128 -
 129
129 -
 130
130 -
 131
131 -
132
-
133
-
134
-
135
-
136
-
137
-
138
-
139
-
140
 |
 |

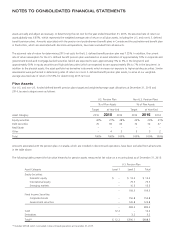
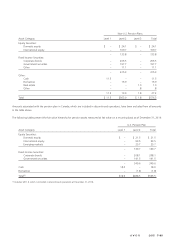
Non-U.S. Pension Plans
Asset Category Level 1 Level 2 Level 3 Total
Equity Securities:
Domestic equity $ – $ 24.1 $ – $ 24.1
International equity – 109.7 – 109.7
– 133.8 – 133.8
Fixed Income Securities:
Corporate bonds – 206.5 – 206.5
Government securities – 197.7 – 197.7
Other – 11.1 – 11.1
– 415.3 – 415.3
Other:
Cash 11.5 – – 11.5
Derivatives – 13.9 – 13.9
Real estate – – 1.0 1.0
Other – – .8 .8
11.5 13.9 1.8 27.2
Total $ 11.5 $563.0 $ 1.8 $576.3
Amounts associated with the pension plan in Canada, which are included in discontinued operations, have been excluded from all amounts
in the table above.
The following tables present the fair value hierarchy for pension assets measured at fair value on a recurring basis as of December 31, 2014:
U.S. Pension Plan
Asset Category Level 1 Level 2 Total
Equity Securities:
Domestic equity $ – $ 21.5 $ 21.5
International equity – 93.5 93.5
Emerging markets – 25.7 25.7
– 140.7 140.7
Fixed Income Securities:
Corporate bonds – 208.1 208.1
Government securities – 141.5 141.5
– 349.6 349.6
Cash 18.0 – 18.0
Derivatives – (1.8) (1.8)
Total(5) $18.0 $488.5 $506.5
(5) Includes $411.6 which is included in discontinued operations at December 31, 2014.
A V O N 2015 F-39
7553_fin.pdf 111