Avon 2015 Annual Report Download - page 8
Download and view the complete annual report
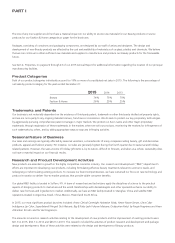
Please find page 8 of the 2015 Avon annual report below. You can navigate through the pages in the report by either clicking on the pages listed below, or by using the keyword search tool below to find specific information within the annual report.-
 1
1 -
 2
2 -
 3
3 -
 4
4 -
 5
5 -
 6
6 -
 7
7 -
 8
8 -
 9
9 -
 10
10 -
 11
11 -
 12
12 -
 13
13 -
 14
14 -
 15
15 -
 16
16 -
 17
17 -
 18
18 -
 19
19 -
20
-
21
-
22
-
23
-
24
-
25
-
26
-
27
-
28
-
29
-
30
-
31
-
32
-
33
-
34
-
35
-
36
-
37
-
38
-
39
-
40
-
41
-
42
-
43
-
44
-
45
-
46
-
47
-
48
-
49
-
50
-
51
-
52
-
53
-
54
-
55
-
56
-
57
-
58
-
59
-
60
-
61
-
62
-
63
-
64
-
65
-
66
-
67
-
68
-
69
-
70
-
71
-
72
-
73
-
74
-
75
-
76
-
77
-
78
-
79
-
80
-
81
-
82
-
83
-
84
-
85
-
86
-
87
-
88
-
89
-
90
-
91
-
92
-
93
-
94
-
95
-
96
-
97
-
98
-
99
-
100
-
101
-
102
-
103
-
104
-
105
-
106
-
107
-
108
-
109
-
110
-
111
-
112
-
113
-
114
-
115
-
116
-
117
-
118
-
119
-
120
-
121
-
122
-
123
-
124
-
125
-
126
-
127
-
128
-
129
-
130
-
131
-
132
-
133
-
134
-
135
-
136
-
137
-
138
-
139
-
140
 |
 |

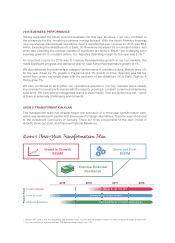
2015 BUSINESS PERFORMANCE
Having separated the North America business into this new structure, I am very confident in
the prospects for the remaining business moving forward. With the North America business
now reported as discontinued operations, Avon’s reported full-year revenue for 2015 was $6.2
billion. Excluding the divestiture of Liz Earle, 2015 revenue increased 3% in constant dollars, and
when also excluding the unusual impacts of significant tax items in Brazil,* the underlying Avon
business grew 5% in constant dollars. Our Adjusted Operating margin for the year was 5.7%.**
An important priority for 2015 was to improve Representative growth in our top markets. We
made significant progress and delivered year-on-year Active Representative growth of 1%.
We also delivered improvements in category performance in constant dollars. Beauty grew 3%
for the year driven by 7% growth in Fragrance and 1% growth in Color. Skincare was flat but
would have grown low single digits with the exclusion of the divestiture of Liz Earle. Fashion &
Home grew 5%.
We also continued to strengthen our operational execution. Our top markets drove steady
improvement in overall performance with the majority growing in constant currency and delivering
solid profit. We have strong management teams in place locally. They are performing well – some
of them in extremely challenging environments.
AVON’S TRANSFORMATION PLAN
The management team has already begun the execution of a three-year transformation plan,
which was developed in parallel with the review of strategic alternatives. This plan was introduced
to the investment community in January. There are three components to the plan: Invest in
Growth, Drive out Cost, and Improve Financial Resilience.
Avon’s Three-Year Transformation Plan
Invest in Growth
$350M
Drive out Cost
$350M
Improve Financial
Resilience
Program Focus
2015 2016 2017 2018
Focus Builds into 2017Invest in Growth
Drive Out Cost
Financial Resilience
Primary Focus to Fuel Growth
Continued Focus to Fund Transformation
* Namely VAT credits that we recognized and benefited from in 2014 and the negative impact of newly enacted IPI taxes during 2015.
** On a reported basis, revenue declined 19% and operating margin was 2.7%.