Avon 2015 Annual Report Download - page 88
Download and view the complete annual report
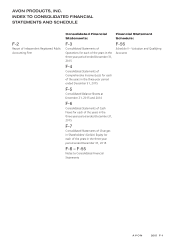
Please find page 88 of the 2015 Avon annual report below. You can navigate through the pages in the report by either clicking on the pages listed below, or by using the keyword search tool below to find specific information within the annual report.-
 1
1 -
2
-
3
-
4
-
5
-
6
-
7
-
8
-
9
-
10
-
11
-
12
-
13
-
14
-
15
-
16
-
17
-
18
-
19
-
20
-
21
-
22
-
23
-
24
-
25
-
26
-
27
-
28
-
29
-
30
-
31
-
32
-
33
-
34
-
35
-
36
-
37
-
38
-
39
-
40
-
41
-
42
-
43
-
44
-
45
-
46
-
47
-
48
-
49
-
50
-
51
-
52
-
53
-
54
-
55
-
56
-
57
-
58
-
59
-
60
-
61
-
62
-
63
-
64
-
65
-
66
-
67
-
68
-
69
-
70
-
71
-
72
-
73
-
74
-
75
-
76
-
77
-
 78
78 -
 79
79 -
 80
80 -
 81
81 -
 82
82 -
 83
83 -
 84
84 -
 85
85 -
 86
86 -
 87
87 -
 88
88 -
 89
89 -
 90
90 -
 91
91 -
 92
92 -
 93
93 -
 94
94 -
 95
95 -
 96
96 -
 97
97 -
 98
98 -
99
-
100
-
101
-
102
-
103
-
104
-
105
-
106
-
107
-
108
-
109
-
110
-
111
-
112
-
113
-
114
-
115
-
116
-
117
-
118
-
119
-
120
-
121
-
122
-
123
-
124
-
125
-
126
-
127
-
128
-
129
-
130
-
131
-
132
-
133
-
134
-
135
-
136
-
137
-
138
-
139
-
140
 |
 |

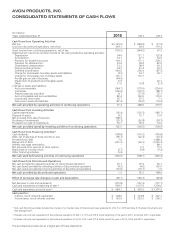
AVON PRODUCTS, INC.
CONSOLIDATED STATEMENTS OF CASH FLOWS
(In millions)
Years ended December 31 2015 2014 2013
Cash Flows from Operating Activities
Net loss $(1,145.6) $ (384.9) $ (51.9)
Loss from discontinued operations, net of tax 349.1 40.4 119.4
(Loss) income from continuing operations, net of tax (796.5) (344.5) 67.5
Adjustments to reconcile net (loss) income to net cash provided by operating activities:
Depreciation 94.0 121.7 132.8
Amortization 32.1 47.7 54.9
Provision for doubtful accounts 144.1 171.1 209.2
Provision for obsolescence 45.4 78.4 82.0
Share-based compensation 51.2 38.9 43.3
Foreign exchange losses 44.3 41.4 26.2
Deferred income taxes 644.6 236.4 (87.5)
Charge for Venezuelan monetary assets and liabilities (4.2) 53.7 34.1
Charge for Venezuelan non-monetary assets 101.7 115.7 –
Pre-tax gain on sale of business (44.9) – –
Impairment of goodwill and intangible assets 6.9 – 42.1
Other 11.6 10.8 (2.3)
Changes in assets and liabilities:
Accounts receivable (184.7) (179.0) (224.0)
Inventories (106.6) (170.5) (88.1)
Prepaid expenses and other 8.7 (77.0) 72.1
Accounts payable and accrued liabilities 80.4 142.6 176.0
Income and other taxes 50.7 57.5 7.1
Noncurrent assets and liabilities (87.4) (56.0) (74.9)
Net cash provided by operating activities of continuing operations 91.4 288.9 470.5
Cash Flows from Investing Activities
Capital expenditures (92.4) (126.3) (189.7)
Disposal of assets 8.2 15.7 13.0
Net proceeds from sale of business 208.3 – –
Purchases of investments (35.3) (26.8) (28.3)
Proceeds from sale of investments 53.7 36.9 14.4
Net cash provided (used) by investing activities of continuing operations 142.5 (100.5) (190.6)
Cash Flows from Financing Activities*
Cash dividends (108.8) (110.2) (106.8)
Debt, net (maturities of three months or less) (59.1) (22.4) (10.3)
Proceeds from debt 7.6 – 1,488.3
Repayment of debt (261.2) (66.5) (1,935.2)
Interest rate swap termination – – 88.1
Net proceeds from exercise of stock options – 0.2 15.9
Repurchase of common stock (3.1) (9.8) (9.4)
Other financing activities (5.9) – –
Net cash used by financing activities of continuing operations (430.5) (208.7) (469.4)
Cash Flows from Discontinued Operations
Net cash provided by operating activities of discontinued operations 20.7 70.9 65.1
Net cash (used) provided by investing activities of discontinued operations (4.2) (4.6) 102.0
Net cash (used) provided by financing activities of discontinued operations (15.0) (10.1) 1.5
Net cash provided by discontinued operations 1.5 56.2 168.6
Effect of exchange rate changes on cash and equivalents (80.7) (183.3) (80.8)
Net decrease in cash and equivalents (275.8) (147.4) (101.7)
Cash and equivalents at beginning of year(1) 960.5 1,107.9 1,209.6
Cash and equivalents at end of year(2) $ 684.7 $ 960.5 $ 1,107.9
Cash paid for:
Interest, net of amounts capitalized $ 128.6 $ 123.8 $ 222.1
Income taxes, net of refunds received $ 162.5 $ 229.2 $ 296.2
* Non-cash financing activities included the change in fair market value of interest-rate swap agreements of $(.7) in 2013(see Note 8, Financial Instruments and
Risk Management).
(1) Includes cash and cash equivalents of discontinued operations of $24.1, $17.9 and $19.9 at the beginning of the year in 2015, 2014 and 2013, respectively.
(2) Includes cash and cash equivalents of discontinued operations of $(2.2), $24.1 and $17.9 at the end of the year in 2015, 2014 and 2013, respectively.
The accompanying notes are an integral part of these statements.
7553_fin.pdf 78