Avon 2015 Annual Report Download - page 123
Download and view the complete annual report
Please find page 123 of the 2015 Avon annual report below. You can navigate through the pages in the report by either clicking on the pages listed below, or by using the keyword search tool below to find specific information within the annual report.-
 1
1 -
2
-
3
-
4
-
5
-
6
-
7
-
8
-
9
-
10
-
11
-
12
-
13
-
14
-
15
-
16
-
17
-
18
-
19
-
20
-
21
-
22
-
23
-
24
-
25
-
26
-
27
-
28
-
29
-
30
-
31
-
32
-
33
-
34
-
35
-
36
-
37
-
38
-
39
-
40
-
41
-
42
-
43
-
44
-
45
-
46
-
47
-
48
-
49
-
50
-
51
-
52
-
53
-
54
-
55
-
56
-
57
-
58
-
59
-
60
-
61
-
62
-
63
-
64
-
65
-
66
-
67
-
68
-
69
-
70
-
71
-
72
-
73
-
74
-
75
-
76
-
77
-
78
-
79
-
80
-
81
-
82
-
83
-
84
-
85
-
86
-
87
-
88
-
89
-
90
-
91
-
92
-
93
-
94
-
95
-
96
-
97
-
98
-
99
-
100
-
101
-
102
-
103
-
104
-
105
-
106
-
107
-
108
-
109
-
110
-
111
-
112
-
 113
113 -
 114
114 -
 115
115 -
 116
116 -
 117
117 -
 118
118 -
 119
119 -
 120
120 -
 121
121 -
 122
122 -
 123
123 -
 124
124 -
 125
125 -
 126
126 -
 127
127 -
 128
128 -
 129
129 -
 130
130 -
 131
131 -
 132
132 -
 133
133 -
134
-
135
-
136
-
137
-
138
-
139
-
140
 |
 |

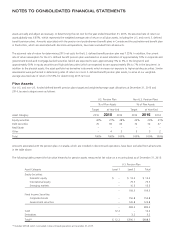
Pension trust assets are invested so as to achieve a return on investment, based on levels of liquidity and investment risk that are prudent
and reasonable as circumstances change from time to time. While we recognize the importance of the preservation of capital, we also
adhere to the theory of capital market pricing which maintains that varying degrees of investment risk should be rewarded with
compensating returns. Consequently, prudent risk-taking is justifiable.
The asset allocation decision includes consideration of the non-investment aspects of the PRA, including future retirements, lump-sum
elections, growth in the number of participants, company contributions, and cash flow. These characteristics of the plan place certain
demands upon the level, risk, and required growth of trust assets. We regularly conduct analyses of the plan’s current and likely future
financial status by forecasting assets, liabilities, benefits and company contributions over time. In so doing, the impact of alternative
investment policies upon the plan’s financial status is measured and an asset mix which balances asset returns and risk is selected.
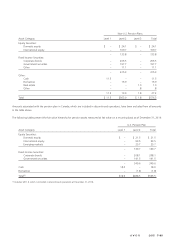
Our decision with regard to asset mix is reviewed periodically. Asset mix guidelines include target allocations and permissible ranges for each
asset category. Assets are monitored on an ongoing basis and rebalanced as required to maintain an asset mix within the permissible ranges.
The guidelines will change from time to time, based on an ongoing evaluation of the plan’s tolerance of investment risk.
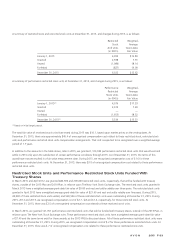
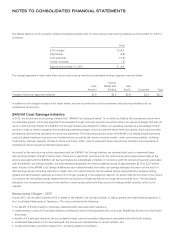
Cash flows
We expect to make contributions related to continuing operations in the range of $25 to $30 to our U.S. defined benefit pension and
postretirement plans and in the range of $20 to $25 to our non-U.S. defined benefit pension and postretirement plans during 2016.
Total benefit payments expected to be paid from the plans are as follows:
Pension Benefits
U.S. Plans
Non-U.S.
Plans Total
Postretirement
Benefits
2016(6) $ 64.2 $ 30.1 $ 94.3 $ 6.9
2017(6) 64.5 30.2 94.7 6.7
2018(6) 51.7 31.7 83.4 6.5
2019(6) 49.3 32.6 81.9 6.3
2020(6) 48.5 32.9 81.4 6.1
2021-2025(6) 212.9 180.6 393.5 27.1
(6) Approximately 80% of the expected U.S. Pension Plan benefit payments and approximately 70% of the expected postretirement benefit payments included in
the table above are associated with discontinued operations. Amounts associated with the pension and postretirement benefit plans in Canada and the
postretirement benefit plan in Puerto Rico, which are associated with discontinued operations, have been excluded from all amounts in the table above.
Postretirement Benefits
For 2015, the assumed rate of future increases in the per capita cost of health care benefits (the health care cost trend rate) was 8.6% for all
claims and is assumed to gradually decrease each year thereafter to 5.1% (in 2022 and beyond for our U.S. plan). A one-percentage point
change in the assumed health care cost trend rates for all postretirement plans would have the following effects:
1 Percentage
Point Increase
1 Percentage
Point Decrease
Effect on total of service and interest cost components $ – $ –
Effect on postretirement benefit obligation .1 (.1)
Postemployment Benefits
We provide postemployment benefits, which include salary continuation, severance benefits, disability benefits and continuation of health
care benefits to eligible former employees after employment but before retirement. The accrued cost for such postemployment benefits was
$18.2 at December 31, 2015 and $25.2 at December 31, 2014, of which $6.0 and $9.0, respectively, are included in discontinued
operations, and the remaining was included in employee benefit plans in the Consolidated Balance Sheets. Amounts associated with
postemployment benefits in Canada, which are included in discontinued operations, have been excluded from all amounts.
Supplemental Retirement Programs
In the U.S., in addition to qualified retirement plans (i.e., the PSA and the PRA), we also maintain unfunded non-qualified plans. We offer a
non-qualified deferred compensation plan, the Avon Products, Inc. Deferred Compensation Plan (the “DCP”), for certain higher paid key
A V O N 2015 F-41
7553_fin.pdf 113