Avon 2015 Annual Report Download - page 134
Download and view the complete annual report
Please find page 134 of the 2015 Avon annual report below. You can navigate through the pages in the report by either clicking on the pages listed below, or by using the keyword search tool below to find specific information within the annual report.-
 1
1 -
2
-
3
-
4
-
5
-
6
-
7
-
8
-
9
-
10
-
11
-
12
-
13
-
14
-
15
-
16
-
17
-
18
-
19
-
20
-
21
-
22
-
23
-
24
-
25
-
26
-
27
-
28
-
29
-
30
-
31
-
32
-
33
-
34
-
35
-
36
-
37
-
38
-
39
-
40
-
41
-
42
-
43
-
44
-
45
-
46
-
47
-
48
-
49
-
50
-
51
-
52
-
53
-
54
-
55
-
56
-
57
-
58
-
59
-
60
-
61
-
62
-
63
-
64
-
65
-
66
-
67
-
68
-
69
-
70
-
71
-
72
-
73
-
74
-
75
-
76
-
77
-
78
-
79
-
80
-
81
-
82
-
83
-
84
-
85
-
86
-
87
-
88
-
89
-
90
-
91
-
92
-
93
-
94
-
95
-
96
-
97
-
98
-
99
-
100
-
101
-
102
-
103
-
104
-
105
-
106
-
107
-
108
-
109
-
110
-
111
-
112
-
113
-
114
-
115
-
116
-
117
-
118
-
119
-
120
-
121
-
122
-
123
-
 124
124 -
 125
125 -
 126
126 -
 127
127 -
 128
128 -
 129
129 -
 130
130 -
 131
131 -
 132
132 -
 133
133 -
 134
134 -
 135
135 -
 136
136 -
 137
137 -
 138
138 -
 139
139 -
 140
140
 |
 |

NOTES TO CONSOLIDATED FINANCIAL STATEMENTS
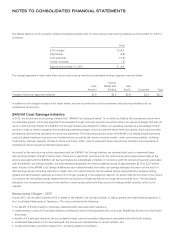
analysis, we determined that the goodwill related to our operations in China was impaired. Specifically, the results of our interim impairment
analysis indicated the estimated fair value of our China reporting unit was less than its respective carrying amount. As a result of our
impairment testing, we recorded a non-cash before tax impairment charge of $38.4 ($38.4 after tax) to reduce the carrying amount of
goodwill. There is no goodwill remaining for our China reporting unit as a result of this impairment. The decline in the fair value of the
China reporting unit was primarily driven by the significant reduction in the forecasted long-term growth rates and cash flows used to
estimate fair value. Fiscal year 2013 revenue for China was expected to be approximately 38% less than the revenue in our projections and
47% less than fiscal year 2012 results.
We also performed an interim impairment analysis for our China finite-lived intangible assets, which indicated the carrying value of these
intangible assets exceeded the estimated future undiscounted cash flows of the business. This resulted in a non-cash before tax impairment
charge of $3.7 ($2.8 after tax) to reduce the carrying amount of these assets. There are no intangible assets remaining for China as a result
of this impairment charge.
China had historically generated positive cash flows, but was not expected to generate positive cash flows in 2013 or for a number of years
thereafter as there was a need for further investment than was previously anticipated. As a result, the expected cash flows of the business as
of the date of our impairment analysis were not at a level sufficient to support the carrying value of the business. As compared to prior
years’ projections for China, the future expectations declined significantly in the 2013 impairment analysis. This reduction in future
expectations led to an impairment of $42.1 being recorded in the third quarter of 2013.
Key Assumptions – Egypt and China
Key assumptions used in measuring the fair value of Egypt and China during these impairment assessments included projections of revenue
and the resulting cash flows, as well as the discount rate (based on the estimated weighted-average cost of capital). To estimate the fair
value of Egypt and China, we forecasted revenue and the resulting cash flows over five years and ten years, respectively, using a DCF model
which included a terminal value at the end of the projection period. We believed that a five-year period and a ten-year period was a
reasonable amount of time in order to return cash flows of Egypt and China, respectively, to normalized, sustainable levels.
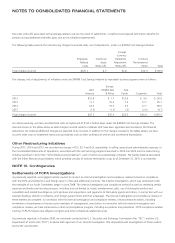
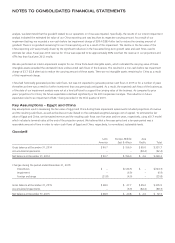
Goodwill
Latin
America
Europe, Middle
East & Africa
Asia
Pacific Total
Gross balance at December 31, 2014 $ 90.7 $ 156.0 $ 85.0 $ 331.7
Accumulated impairments – – (82.4) (82.4)
Net balance at December 31, 2014 $ 90.7 $ 156.0 $ 2.6 $ 249.3
Changes during the period ended December 31, 2015:
Divestitures $ – $(124.3) $ – $(124.3)
Impairment – (6.9) – (6.9)
Foreign exchange (21.8) (4.0) – (25.8)
Gross balance at December 31, 2015 $ 68.9 $ 27.7 $ 85.0 $ 305.9
Accumulated impairments – (6.9) (82.4) (89.3)
Net balance at December 31, 2015 $ 68.9 $ 20.8 $ 2.6 $ 92.3
7553_fin.pdf 124