Avon 2015 Annual Report Download - page 55
Download and view the complete annual report
Please find page 55 of the 2015 Avon annual report below. You can navigate through the pages in the report by either clicking on the pages listed below, or by using the keyword search tool below to find specific information within the annual report.-
 1
1 -
2
-
3
-
4
-
5
-
6
-
7
-
8
-
9
-
10
-
11
-
12
-
13
-
14
-
15
-
16
-
17
-
18
-
19
-
20
-
21
-
22
-
23
-
24
-
25
-
26
-
27
-
28
-
29
-
30
-
31
-
32
-
33
-
34
-
35
-
36
-
37
-
38
-
39
-
40
-
41
-
42
-
43
-
44
-
 45
45 -
 46
46 -
 47
47 -
 48
48 -
 49
49 -
 50
50 -
 51
51 -
 52
52 -
 53
53 -
 54
54 -
 55
55 -
 56
56 -
 57
57 -
 58
58 -
 59
59 -
 60
60 -
 61
61 -
 62
62 -
 63
63 -
 64
64 -
 65
65 -
66
-
67
-
68
-
69
-
70
-
71
-
72
-
73
-
74
-
75
-
76
-
77
-
78
-
79
-
80
-
81
-
82
-
83
-
84
-
85
-
86
-
87
-
88
-
89
-
90
-
91
-
92
-
93
-
94
-
95
-
96
-
97
-
98
-
99
-
100
-
101
-
102
-
103
-
104
-
105
-
106
-
107
-
108
-
109
-
110
-
111
-
112
-
113
-
114
-
115
-
116
-
117
-
118
-
119
-
120
-
121
-
122
-
123
-
124
-
125
-
126
-
127
-
128
-
129
-
130
-
131
-
132
-
133
-
134
-
135
-
136
-
137
-
138
-
139
-
140
 |
 |

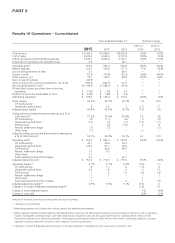
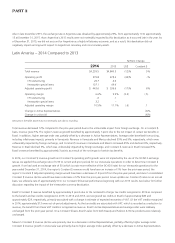
2014 Compared to 2013
Revenue
Total revenue in 2014 declined 10% compared to the prior-year period, due to unfavorable foreign exchange. Constant $ revenue increased
3%, and benefited by approximately 1 point due to the net impact of certain tax benefits in Brazil. In 2014 and 2013, we recognized tax
credits in Brazil of approximately $85 and approximately $29, respectively, primarily associated with a change in estimate of expected
recoveries of VAT. See “Segment Review – Latin America” in this MD&A for a further discussion of the tax benefits in Brazil. Constant $
revenue benefited from higher average order, which was partially offset by a 4% decrease in Active Representatives. The net impact of price
and mix increased 5%, as pricing benefited from inflationary impacts in Latin America, primarily in Argentina and Venezuela, while units
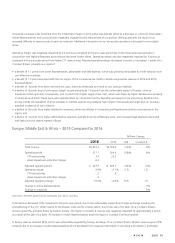
sold decreased 2%. During 2014, our Constant $ revenue benefited from net growth in Latin America and Europe, Middle East & Africa,
which was partially offset by a net decline in Asia Pacific. Constant $ revenue growth in Latin America was primarily driven by Venezuela
largely due to inflationary pricing, which was partially offset by declines in Mexico. Constant $ revenue growth in Europe, Middle East &
Africa was driven by South Africa and the United Kingdom, which was partially offset by revenue declines in Russia and Turkey. Constant $
revenue in Russia was negatively impacted by a difficult economy, including the impact of geopolitical uncertainties, and its decline in the
first half of 2014 was partially offset by Constant $ revenue growth in the second half of 2014 driven by actions to improve unit sales. In
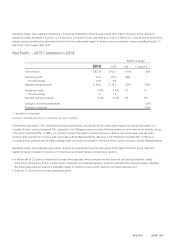
Asia Pacific, Constant $ revenue declined as compared to 2013 as growth in the Philippines was more than offset by declines in the other
Asia Pacific markets. See “Segment Review” in this MD&A for additional information related to changes in revenue by segment.
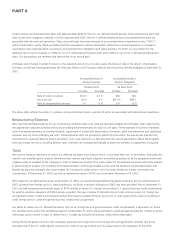
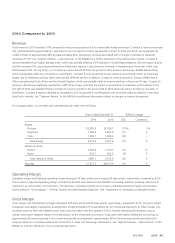
On a category basis, our net sales and associated growth rates were as follows:
Years ended December 31 %/Point Change
2014 2013 US$ Constant $
Beauty:
Skincare $2,281.0 $2,556.7 (11)% 1%
Fragrance 1,966.3 2,202.4 (11) 5
Color 1,365.1 1,548.3 (12) –
Total Beauty 5,612.4 6,307.4 (11) 2
Fashion & Home:
Fashion 1,040.4 1,169.7 (11) (1)
Home 819.7 902.3 (9) 6
Total Fashion & Home 1,860.1 2,072.0 (10) 2
Net sales $7,472.5 $8,379.4 (11) 2
Operating Margin
Operating margin and Adjusted operating margin decreased 70 basis points and increased 20 basis points, respectively, compared to 2013.
The increase in Adjusted operating margin includes the benefits associated with the $400M Cost Savings Initiative, primarily reductions in
headcount, as well as other cost reductions. The decrease in operating margin and increase in Adjusted operating margin are discussed
further below in “Gross Margin,” “Selling, General and Administrative Expenses” and “Impairment of Goodwill and Intangible Assets.”
Gross Margin
Gross margin and Adjusted gross margin decreased 200 basis points and 90 basis points, respectively, compared to 2013. The gross margin
comparison was largely impacted by an adjustment of approximately $116 associated with our Venezuela operations to reflect certain non-
monetary assets at their net realizable value, which was recorded in the first quarter of 2014. Partially offsetting the decrease in gross
margin was a lower negative impact of the devaluation of the Venezuelan currency in conjunction with highly inflationary accounting, as
approximately $5 was recognized in the current-year period as compared to approximately $45 in the prior-year period associated with
carrying certain non-monetary assets at the historical U.S. dollar cost following a devaluation. See “Segment Review – Latin America” in this
MD&A for a further discussion of our Venezuela operations.
A V O N 2015 43
7553_fin.pdf 45