Audi 2014 Annual Report Download - page 271
Download and view the complete annual report
Please find page 271 of the 2014 Audi annual report below. You can navigate through the pages in the report by either clicking on the pages listed below, or by using the keyword search tool below to find specific information within the annual report.-
 1
1 -
2
-
3
-
4
-
5
-
6
-
7
-
8
-
9
-
10
-
11
-
12
-
13
-
14
-
15
-
16
-
17
-
18
-
19
-
20
-
21
-
22
-
23
-
24
-
25
-
26
-
27
-
28
-
29
-
30
-
31
-
32
-
33
-
34
-
35
-
36
-
37
-
38
-
39
-
40
-
41
-
42
-
43
-
44
-
45
-
46
-
47
-
48
-
49
-
50
-
51
-
52
-
53
-
54
-
55
-
56
-
57
-
58
-
59
-
60
-
61
-
62
-
63
-
64
-
65
-
66
-
67
-
68
-
69
-
70
-
71
-
72
-
73
-
74
-
75
-
76
-
77
-
78
-
79
-
80
-
81
-
82
-
83
-
84
-
85
-
86
-
87
-
88
-
89
-
90
-
91
-
92
-
93
-
94
-
95
-
96
-
97
-
98
-
99
-
100
-
101
-
102
-
103
-
104
-
105
-
106
-
107
-
108
-
109
-
110
-
111
-
112
-
113
-
114
-
115
-
116
-
117
-
118
-
119
-
120
-
121
-
122
-
123
-
124
-
125
-
126
-
127
-
128
-
129
-
130
-
131
-
132
-
133
-
134
-
135
-
136
-
137
-
138
-
139
-
140
-
141
-
142
-
143
-
144
-
145
-
146
-
147
-
148
-
149
-
150
-
151
-
152
-
153
-
154
-
155
-
156
-
157
-
158
-
159
-
160
-
161
-
162
-
163
-
164
-
165
-
166
-
167
-
168
-
169
-
170
-
171
-
172
-
173
-
174
-
175
-
176
-
177
-
178
-
179
-
180
-
181
-
182
-
183
-
184
-
185
-
186
-
187
-
188
-
189
-
190
-
191
-
192
-
193
-
194
-
195
-
196
-
197
-
198
-
199
-
200
-
201
-
202
-
203
-
204
-
205
-
206
-
207
-
208
-
209
-
210
-
211
-
212
-
213
-
214
-
215
-
216
-
217
-
218
-
219
-
220
-
221
-
222
-
223
-
224
-
225
-
226
-
227
-
228
-
229
-
230
-
231
-
232
-
233
-
234
-
235
-
236
-
237
-
238
-
239
-
240
-
241
-
242
-
243
-
244
-
245
-
246
-
247
-
248
-
249
-
250
-
251
-
252
-
253
-
254
-
255
-
256
-
257
-
258
-
259
-
260
-
 261
261 -
 262
262 -
 263
263 -
 264
264 -
 265
265 -
 266
266 -
 267
267 -
 268
268 -
 269
269 -
 270
270 -
 271
271 -
 272
272 -
 273
273 -
 274
274 -
 275
275 -
 276
276 -
 277
277 -
 278
278 -
 279
279 -
 280
280 -
 281
281 -
282
-
283
-
284
-
285
-
286
-
287
-
288
-
289
-
290
-
291
-
292
-
293
-
294
 |
 |

NOTES TO THE CONSOLIDATED FINANCIAL STATEMENTS
ADDITIONAL DISCLOSURES
>>
271
///
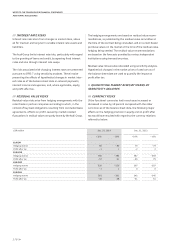
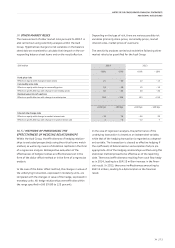
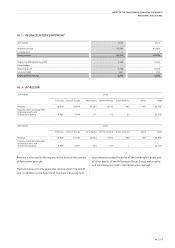
OTHER MARKET RISKS
The measurement of other market risks pursuant to IFRS 7 is
also carried out using sensitivity analyses within the Audi
Group. Hypothetical changes to risk variables on the balance
sheet date are examined to calculate their impact on the cor-
responding balance sheet items and on the result after tax.
Depending on the type of risk, there are various possible risk
variables (primarily share prices, commodity prices, market
interest rates, market prices of used cars).
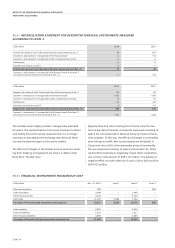
The sensitivity analyses carried out enable the following other
market risks to be quantified for the Audi Group:
EUR million
2014 2013
+10% – 10% +10% – 10%
Fund price risks
Effects on equity with change in share prices 21 – 30 12 – 13
Commodity price risks
Effects on equity with change in commodity prices 18 – 18 15 – 15
Effects on profit after tax with change in commodity prices 42 – 42 30 – 30
Residual value risks of used cars
Effects on profit after tax with change in market prices 194 – 194 153 – 153
+100 bps – 100 bps +100 bps – 100 bps
Interest rate change risks
Effects on equity with change in market interest rate – 74 74 – 26 20
Effects on profit after tax with change in market interest rate 3 –3 – 12 7
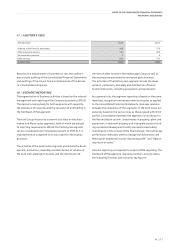
36.5 /
METHODS OF MONITORING THE
EFFECTIVENESS OF HEDGING RELATIONSHIPS
Within the Audi Group, the effectiveness of hedging relation-
ships is evaluated prospectively using the critical terms match
method, as well as by means of statistical methods in the form
of a regression analysis. Retrospective evaluation of the
effectiveness of hedges involves an effectiveness test in the
form of the dollar offset method or in the form of a regression
analysis.
In the case of the dollar offset method, the changes in value of
the underlying transaction, expressed in monetary units, are
compared with the changes in value of the hedge, expressed in
monetary units. All hedge relationships were effective within
the range specified in IAS 39 (80 to 125 percent).
In the case of regression analysis, the performance of the
underlying transaction is viewed as an independent variable,
while that of the hedging transaction is regarded as a depend-
ent variable. The transaction is classed as effective hedging if
the coefficients of determination and escalation factors are
appropriate. All of the hedging relationships verified using this
statistical method proved to be effective as of the reporting
date. There was ineffectiveness resulting from cash flow hedg-
es in 2014, leading to a EUR 15 million increase in the finan-
cial result. In 2013, there was ineffectiveness amounting to
EUR 13 million, leading to a deterioration in the financial
result.