Audi 2014 Annual Report Download - page 265
Download and view the complete annual report
Please find page 265 of the 2014 Audi annual report below. You can navigate through the pages in the report by either clicking on the pages listed below, or by using the keyword search tool below to find specific information within the annual report.-
 1
1 -
2
-
3
-
4
-
5
-
6
-
7
-
8
-
9
-
10
-
11
-
12
-
13
-
14
-
15
-
16
-
17
-
18
-
19
-
20
-
21
-
22
-
23
-
24
-
25
-
26
-
27
-
28
-
29
-
30
-
31
-
32
-
33
-
34
-
35
-
36
-
37
-
38
-
39
-
40
-
41
-
42
-
43
-
44
-
45
-
46
-
47
-
48
-
49
-
50
-
51
-
52
-
53
-
54
-
55
-
56
-
57
-
58
-
59
-
60
-
61
-
62
-
63
-
64
-
65
-
66
-
67
-
68
-
69
-
70
-
71
-
72
-
73
-
74
-
75
-
76
-
77
-
78
-
79
-
80
-
81
-
82
-
83
-
84
-
85
-
86
-
87
-
88
-
89
-
90
-
91
-
92
-
93
-
94
-
95
-
96
-
97
-
98
-
99
-
100
-
101
-
102
-
103
-
104
-
105
-
106
-
107
-
108
-
109
-
110
-
111
-
112
-
113
-
114
-
115
-
116
-
117
-
118
-
119
-
120
-
121
-
122
-
123
-
124
-
125
-
126
-
127
-
128
-
129
-
130
-
131
-
132
-
133
-
134
-
135
-
136
-
137
-
138
-
139
-
140
-
141
-
142
-
143
-
144
-
145
-
146
-
147
-
148
-
149
-
150
-
151
-
152
-
153
-
154
-
155
-
156
-
157
-
158
-
159
-
160
-
161
-
162
-
163
-
164
-
165
-
166
-
167
-
168
-
169
-
170
-
171
-
172
-
173
-
174
-
175
-
176
-
177
-
178
-
179
-
180
-
181
-
182
-
183
-
184
-
185
-
186
-
187
-
188
-
189
-
190
-
191
-
192
-
193
-
194
-
195
-
196
-
197
-
198
-
199
-
200
-
201
-
202
-
203
-
204
-
205
-
206
-
207
-
208
-
209
-
210
-
211
-
212
-
213
-
214
-
215
-
216
-
217
-
218
-
219
-
220
-
221
-
222
-
223
-
224
-
225
-
226
-
227
-
228
-
229
-
230
-
231
-
232
-
233
-
234
-
235
-
236
-
237
-
238
-
239
-
240
-
241
-
242
-
243
-
244
-
245
-
246
-
247
-
248
-
249
-
250
-
251
-
252
-
253
-
254
-
 255
255 -
 256
256 -
 257
257 -
 258
258 -
 259
259 -
 260
260 -
 261
261 -
 262
262 -
 263
263 -
 264
264 -
 265
265 -
 266
266 -
 267
267 -
 268
268 -
 269
269 -
 270
270 -
 271
271 -
 272
272 -
 273
273 -
 274
274 -
 275
275 -
276
-
277
-
278
-
279
-
280
-
281
-
282
-
283
-
284
-
285
-
286
-
287
-
288
-
289
-
290
-
291
-
292
-
293
-
294
 |
 |

NOTES TO THE CONSOLIDATED FINANCIAL STATEMENTS
ADDITIONAL DISCLOSURES
>>
265
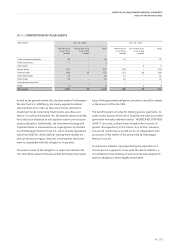
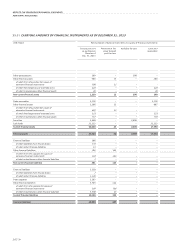
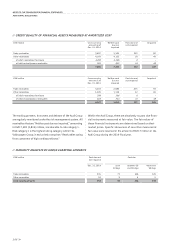
EUR million
Dec. 31, 2013 Level 1 Level 2 Level 3
Other participations 290 – 102 189
Trade receivables 3,176 – 3,176 –
Other financial assets 1,160 – 1,160 –
Cash funds 13,332 6,540 6,792 –
Fair values of financial assets measured at amortized cost 17,958 6,540 11,230 189
Trade payables 5,163 – 5,163 –
Financial liabilities 1,413 – 1,413 –
Other financial liabilities 3,541 – 3,541 –
Fair values of financial liabilities measured at amortized cost 10,116 – 10,116 –
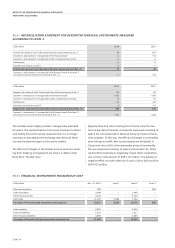
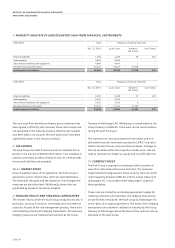
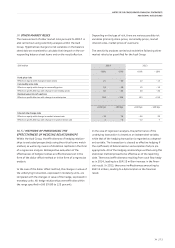
In the case of the financial instruments measured at amortized
cost, the fair value levels to be quoted basically correspond to
the criteria listed under Note 35.1. The fair value of these
financial instruments, such as receivables and liabilities, is
calculated by discounting using a market interest rate that
adequately reflects the risks and is based on matched maturi-
ties. Within non-current assets and liabilities, there were no
significant changes in the ratios between balance sheet value
and fair value. For reasons of materiality, the fair value for
current balance sheet items is equated with the balance sheet
value. In order to reconcile the tables above, equity instruments
reported at their carrying amount are assigned to level 3 in the
fair value hierarchy.
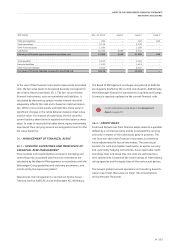
36 /
MANAGEMENT OF FINANCIAL RISKS
36.1 /
HEDGING GUIDELINES AND PRINCIPLES OF
FINANCIAL RISK MANAGEMENT
The principles and responsibilities involved in managing and
controlling risks associated with financial instruments are
stipulated by the Board of Management in accordance with the
Volkswagen Group guidelines and statutory parameters, and
monitored by the Supervisory Board.
Operational risk management is carried out by the Group
Treasury, both at AUDI AG and at Volkswagen AG, Wolfsburg.
The Board of Management and Supervisory Board of AUDI AG
are regularly briefed on the current risk situation. Additionally,
the Volkswagen Executive Committee for Liquidity and Foreign
Currency is regularly updated on the current financial risks.
Further information can be found in the Management
Report on page 201.
36.2 /
CREDIT RISKS
Credit and default risks from financial assets relate to a possible
default by a contractual party and do not exceed the carrying
amounts in respect of the contractual party in question. The
risk from non-derivative financial instruments is covered by
value adjustments for loss of receivables. The contractual
partners for cash and capital investments, as well as currency
and commodity hedging instruments, have impeccable credit
standings. Over and above this, the risks are restricted by a
limit system that is based on the credit ratings of international
rating agencies and the equity base of the contractual parties.
The Group’s global business operations and resulting diversifi-
cation meant that there were no major risk concentrations
during the past fiscal year.