Audi 2014 Annual Report Download - page 173
Download and view the complete annual report
Please find page 173 of the 2014 Audi annual report below. You can navigate through the pages in the report by either clicking on the pages listed below, or by using the keyword search tool below to find specific information within the annual report.-
 1
1 -
2
-
3
-
4
-
5
-
6
-
7
-
8
-
9
-
10
-
11
-
12
-
13
-
14
-
15
-
16
-
17
-
18
-
19
-
20
-
21
-
22
-
23
-
24
-
25
-
26
-
27
-
28
-
29
-
30
-
31
-
32
-
33
-
34
-
35
-
36
-
37
-
38
-
39
-
40
-
41
-
42
-
43
-
44
-
45
-
46
-
47
-
48
-
49
-
50
-
51
-
52
-
53
-
54
-
55
-
56
-
57
-
58
-
59
-
60
-
61
-
62
-
63
-
64
-
65
-
66
-
67
-
68
-
69
-
70
-
71
-
72
-
73
-
74
-
75
-
76
-
77
-
78
-
79
-
80
-
81
-
82
-
83
-
84
-
85
-
86
-
87
-
88
-
89
-
90
-
91
-
92
-
93
-
94
-
95
-
96
-
97
-
98
-
99
-
100
-
101
-
102
-
103
-
104
-
105
-
106
-
107
-
108
-
109
-
110
-
111
-
112
-
113
-
114
-
115
-
116
-
117
-
118
-
119
-
120
-
121
-
122
-
123
-
124
-
125
-
126
-
127
-
128
-
129
-
130
-
131
-
132
-
133
-
134
-
135
-
136
-
137
-
138
-
139
-
140
-
141
-
142
-
143
-
144
-
145
-
146
-
147
-
148
-
149
-
150
-
151
-
152
-
153
-
154
-
155
-
156
-
157
-
158
-
159
-
160
-
161
-
162
-
 163
163 -
 164
164 -
 165
165 -
 166
166 -
 167
167 -
 168
168 -
 169
169 -
 170
170 -
 171
171 -
 172
172 -
 173
173 -
 174
174 -
 175
175 -
 176
176 -
 177
177 -
 178
178 -
 179
179 -
 180
180 -
 181
181 -
 182
182 -
 183
183 -
184
-
185
-
186
-
187
-
188
-
189
-
190
-
191
-
192
-
193
-
194
-
195
-
196
-
197
-
198
-
199
-
200
-
201
-
202
-
203
-
204
-
205
-
206
-
207
-
208
-
209
-
210
-
211
-
212
-
213
-
214
-
215
-
216
-
217
-
218
-
219
-
220
-
221
-
222
-
223
-
224
-
225
-
226
-
227
-
228
-
229
-
230
-
231
-
232
-
233
-
234
-
235
-
236
-
237
-
238
-
239
-
240
-
241
-
242
-
243
-
244
-
245
-
246
-
247
-
248
-
249
-
250
-
251
-
252
-
253
-
254
-
255
-
256
-
257
-
258
-
259
-
260
-
261
-
262
-
263
-
264
-
265
-
266
-
267
-
268
-
269
-
270
-
271
-
272
-
273
-
274
-
275
-
276
-
277
-
278
-
279
-
280
-
281
-
282
-
283
-
284
-
285
-
286
-
287
-
288
-
289
-
290
-
291
-
292
-
293
-
294
 |
 |

FINANCIAL PERFORMANCE INDICATORS
NET WORTH
>>
173
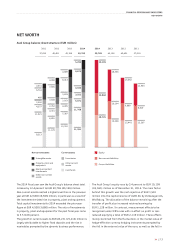
NET WORTH
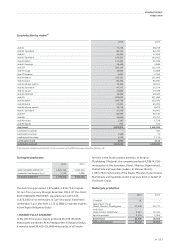
Audi Group balance sheet structure (EUR million)
The 2014 fiscal year saw the Audi Group’s balance sheet total
increase by 12.4 percent to EUR 50,769 (45,156) million.
Non-current assets reached a higher level than in the previous
year at EUR 22,538 (19,943) million, in particular as a result of
the investment-related rise in property, plant and equipment.
Total capital investments for 2014 exceeded the prior-year
figure at EUR 4,500 (3,680) million. The ratio of investments
in property, plant and equipment for the past fiscal year came
to 5.5 (4.8) percent.
The growth in current assets to EUR 28,231 (25,214) million is
largely attributable to higher fixed deposits and the rise in
receivables prompted by the dynamic business performance.
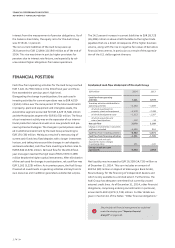
The Audi Group’s equity rose by 3.4 percent to EUR 19,199
(18,565) million as of December 31, 2014. The main factor
behind this growth was the cash injection of EUR 1,591
million into the capital reserve of AUDI AG by Volkswagen AG,
Wolfsburg. The allocation of the balance remaining after the
transfer of profit also increased retained earnings by
EUR 1,128 million. In contrast, measurement effects to be
recognized under IFRS rules with no effect on profit or loss
reduced equity by a total of EUR 2,119 million. These effects
mainly stemmed from the fluctuations in the market value of
hedge-effective currency hedging instruments prompted by
the fall in the external value of the euro, as well as the fall in
Current assets:
Other non-current
assets
Equity-accounted
investments
Property, plant and
equipment
Intangible assets
Non-current assets:
Cash funds
Inventories
Other current
assets
Non-current liabilities
Current liabilities
Equity
2014
50,769
2012
40,401
2011
37,019
2013
45,156
2011
37,019
2013
45,156
2014
50,769
2012
40,401
16,398
10,194
18,565
15,441
9,869
15,092
15,507
8,610
12,903
18,725
12,844
19,199
13,332
7,387
4,495
4,689
8,513
11,921
4,377
2,531
2,502 3,163
6,716
460
11,170
6,855
4,331
4,038
2,762
3,638
3,678
7,605
8,413
11,391
11,768
5,071
3,551
4,022
9,673
5,292