Audi 2014 Annual Report Download - page 253
Download and view the complete annual report
Please find page 253 of the 2014 Audi annual report below. You can navigate through the pages in the report by either clicking on the pages listed below, or by using the keyword search tool below to find specific information within the annual report.-
 1
1 -
2
-
3
-
4
-
5
-
6
-
7
-
8
-
9
-
10
-
11
-
12
-
13
-
14
-
15
-
16
-
17
-
18
-
19
-
20
-
21
-
22
-
23
-
24
-
25
-
26
-
27
-
28
-
29
-
30
-
31
-
32
-
33
-
34
-
35
-
36
-
37
-
38
-
39
-
40
-
41
-
42
-
43
-
44
-
45
-
46
-
47
-
48
-
49
-
50
-
51
-
52
-
53
-
54
-
55
-
56
-
57
-
58
-
59
-
60
-
61
-
62
-
63
-
64
-
65
-
66
-
67
-
68
-
69
-
70
-
71
-
72
-
73
-
74
-
75
-
76
-
77
-
78
-
79
-
80
-
81
-
82
-
83
-
84
-
85
-
86
-
87
-
88
-
89
-
90
-
91
-
92
-
93
-
94
-
95
-
96
-
97
-
98
-
99
-
100
-
101
-
102
-
103
-
104
-
105
-
106
-
107
-
108
-
109
-
110
-
111
-
112
-
113
-
114
-
115
-
116
-
117
-
118
-
119
-
120
-
121
-
122
-
123
-
124
-
125
-
126
-
127
-
128
-
129
-
130
-
131
-
132
-
133
-
134
-
135
-
136
-
137
-
138
-
139
-
140
-
141
-
142
-
143
-
144
-
145
-
146
-
147
-
148
-
149
-
150
-
151
-
152
-
153
-
154
-
155
-
156
-
157
-
158
-
159
-
160
-
161
-
162
-
163
-
164
-
165
-
166
-
167
-
168
-
169
-
170
-
171
-
172
-
173
-
174
-
175
-
176
-
177
-
178
-
179
-
180
-
181
-
182
-
183
-
184
-
185
-
186
-
187
-
188
-
189
-
190
-
191
-
192
-
193
-
194
-
195
-
196
-
197
-
198
-
199
-
200
-
201
-
202
-
203
-
204
-
205
-
206
-
207
-
208
-
209
-
210
-
211
-
212
-
213
-
214
-
215
-
216
-
217
-
218
-
219
-
220
-
221
-
222
-
223
-
224
-
225
-
226
-
227
-
228
-
229
-
230
-
231
-
232
-
233
-
234
-
235
-
236
-
237
-
238
-
239
-
240
-
241
-
242
-
 243
243 -
 244
244 -
 245
245 -
 246
246 -
 247
247 -
 248
248 -
 249
249 -
 250
250 -
 251
251 -
 252
252 -
 253
253 -
 254
254 -
 255
255 -
 256
256 -
 257
257 -
 258
258 -
 259
259 -
 260
260 -
 261
261 -
 262
262 -
 263
263 -
264
-
265
-
266
-
267
-
268
-
269
-
270
-
271
-
272
-
273
-
274
-
275
-
276
-
277
-
278
-
279
-
280
-
281
-
282
-
283
-
284
-
285
-
286
-
287
-
288
-
289
-
290
-
291
-
292
-
293
-
294
 |
 |

NOTES TO THE CONSOLIDATED FINANCIAL STATEMENTS
NOTES TO THE BALANCE SHEET
>>
253
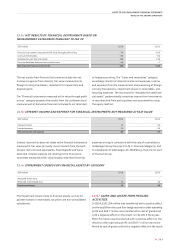
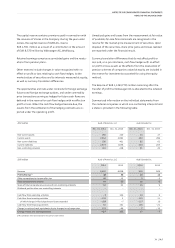
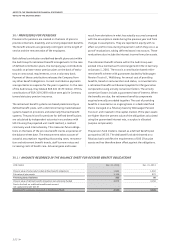
30.2 /
PRESENT VALUE OF DEFINED BENEFIT OBLIGATIONS
EUR million
2014 2013
Present value on Jan. 1 4,181 4,314
Service costs 131 132
Interest expense 151 136
Actuarial gains (–)/losses (+) following changes in demographic assumptions +1 +1
Actuarial gains (–)/losses (+) following changes in financial assumptions + 1,379 – 317
Actuarial gains (–)/losses (+) following experience-based adjustments 0 + 17
Pension payments from company assets – 98 – 95
Pension payments from fund assets –9 –8
Past service costs (incl. plan curtailment) 1 –
Effects from transfers 4 5
Currency differences 0 –4
Present value on Dec. 31 5,741 4,181
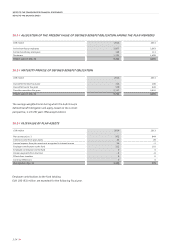
30.3 /
SENSITIVITY ANALYSES
Present value of defined benefit pension obligation if Dec. 31, 2014 Dec. 31, 2013
EUR million in % EUR million in %
Discount rate + 0.5 percentage points 5,184 – 9.70% 3,906 – 6.58%
– 0.5 percentage points 6,390 11.30% 4,594 9.86%
Remuneration trend +0.5 percentage points 5,845 1.81% 4,253 1.71%
– 0.5 percentage points 5,644 – 1.69% 4,113 – 1.63%
Retirement benefit trend +0.5 percentage points 6,091 6.09% 4,411 5.49%
– 0.5 percentage points 5,424 – 5.52% 3,987 – 4.65%
Life expectancy +1 year 5,900 2.77% 4,280 2.36%
A change of half a percentage point in each case in the key
actuarial assumptions used to calculate the present value of
the defined benefit pension obligation would result in the
effects shown in the table.
The sensitivity analyses take into account a changed assump-
tion in each case, although the other assumptions remain
unchanged compared with the original calculation, meaning
that potential correlation effects between the individual as-
sumptions are not taken into account.
To investigate the sensitivity of the present value of the de-
fined benefit obligation to any change in the assumed life
expectancy, the expected mortality rate is reduced on a scale
that is roughly equivalent to an increase in life expectancy of
one year.