Audi 2014 Annual Report Download - page 245
Download and view the complete annual report
Please find page 245 of the 2014 Audi annual report below. You can navigate through the pages in the report by either clicking on the pages listed below, or by using the keyword search tool below to find specific information within the annual report.-
 1
1 -
2
-
3
-
4
-
5
-
6
-
7
-
8
-
9
-
10
-
11
-
12
-
13
-
14
-
15
-
16
-
17
-
18
-
19
-
20
-
21
-
22
-
23
-
24
-
25
-
26
-
27
-
28
-
29
-
30
-
31
-
32
-
33
-
34
-
35
-
36
-
37
-
38
-
39
-
40
-
41
-
42
-
43
-
44
-
45
-
46
-
47
-
48
-
49
-
50
-
51
-
52
-
53
-
54
-
55
-
56
-
57
-
58
-
59
-
60
-
61
-
62
-
63
-
64
-
65
-
66
-
67
-
68
-
69
-
70
-
71
-
72
-
73
-
74
-
75
-
76
-
77
-
78
-
79
-
80
-
81
-
82
-
83
-
84
-
85
-
86
-
87
-
88
-
89
-
90
-
91
-
92
-
93
-
94
-
95
-
96
-
97
-
98
-
99
-
100
-
101
-
102
-
103
-
104
-
105
-
106
-
107
-
108
-
109
-
110
-
111
-
112
-
113
-
114
-
115
-
116
-
117
-
118
-
119
-
120
-
121
-
122
-
123
-
124
-
125
-
126
-
127
-
128
-
129
-
130
-
131
-
132
-
133
-
134
-
135
-
136
-
137
-
138
-
139
-
140
-
141
-
142
-
143
-
144
-
145
-
146
-
147
-
148
-
149
-
150
-
151
-
152
-
153
-
154
-
155
-
156
-
157
-
158
-
159
-
160
-
161
-
162
-
163
-
164
-
165
-
166
-
167
-
168
-
169
-
170
-
171
-
172
-
173
-
174
-
175
-
176
-
177
-
178
-
179
-
180
-
181
-
182
-
183
-
184
-
185
-
186
-
187
-
188
-
189
-
190
-
191
-
192
-
193
-
194
-
195
-
196
-
197
-
198
-
199
-
200
-
201
-
202
-
203
-
204
-
205
-
206
-
207
-
208
-
209
-
210
-
211
-
212
-
213
-
214
-
215
-
216
-
217
-
218
-
219
-
220
-
221
-
222
-
223
-
224
-
225
-
226
-
227
-
228
-
229
-
230
-
231
-
232
-
233
-
234
-
 235
235 -
 236
236 -
 237
237 -
 238
238 -
 239
239 -
 240
240 -
 241
241 -
 242
242 -
 243
243 -
 244
244 -
 245
245 -
 246
246 -
 247
247 -
 248
248 -
 249
249 -
 250
250 -
 251
251 -
 252
252 -
 253
253 -
 254
254 -
 255
255 -
256
-
257
-
258
-
259
-
260
-
261
-
262
-
263
-
264
-
265
-
266
-
267
-
268
-
269
-
270
-
271
-
272
-
273
-
274
-
275
-
276
-
277
-
278
-
279
-
280
-
281
-
282
-
283
-
284
-
285
-
286
-
287
-
288
-
289
-
290
-
291
-
292
-
293
-
294
 |
 |
NOTES TO THE CONSOLIDATED FINANCIAL STATEMENTS
NOTES TO THE BALANCE SHEET
>>
245
//
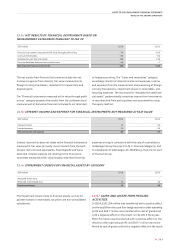
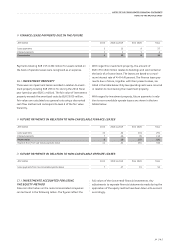
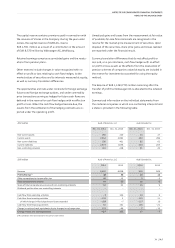
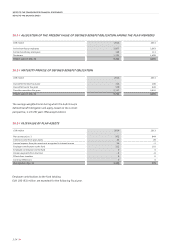
FINANCE LEASE PAYMENTS DUE IN THE FUTURE
EUR million
2015 2016 to 2019 from 2020 Total
Lease payments 3 15 9 27
Interest elements 1 2 1 4
Present value 2 12 8 22
Payments totaling EUR 155 (138) million for assets rented on
the basis of operate leases were recognized as an expense.
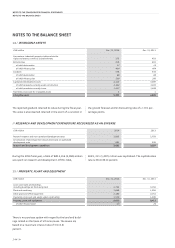
16 /
INVESTMENT PROPERTY
There were no impairment losses recorded in relation to invest-
ment property totaling EUR 293 (171) during the 2014 fiscal
year (previous year EUR 1 million). The fair value of investment
property exceeds the amortized costs by EUR 28 (0) million.
Fair values are calculated as a general rule using a discounted
cash flow method and correspond to level 3 of the fair value
hierarchy.
With regard to investment property, the amount of
EUR 175 (154) million relates to buildings and land rented on
the basis of a finance lease. The leases are based on a maxi-
mum interest rate of 4.4 (4.4) percent. The finance lease pay-
ments due in future, together with their present values, are
listed in the table below. Only low operating costs were incurred
in relation to maintaining the investment property.
With regard to investment property, future payments in rela-
tion to non-cancelable operate leases are shown in the two
tables below.
//
FUTURE PAYMENTS IN RELATION TO NON-CANCELABLE FINANCE LEASES
EUR million
2015 2016 to 2019 from 2020 Total
Lease payments 12 44 234 291
Interest elements 7 26 78 110
Present value 6 19 157 181
Payment flows from sub-leasing (operate lease) 11 42 281 334
//
FUTURE PAYMENTS IN RELATION TO NON-CANCELABLE OPERATE LEASES
EUR million
2015 2016 to 2019 from 2020 Total
Lease payments from non-cancelable operate leases 7 27 19 53
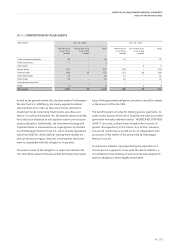
17 /
INVESTMENTS ACCOUNTED FOR USING
THE EQUITY METHOD
Financial information on the material associated companies
can be found in the following tables. The figures reflect the
full values of the (converted) financial statements. Any
adjustments to separate financial statements made during the
application of the equity method have been taken into account
accordingly.