Audi 2014 Annual Report Download - page 270
Download and view the complete annual report
Please find page 270 of the 2014 Audi annual report below. You can navigate through the pages in the report by either clicking on the pages listed below, or by using the keyword search tool below to find specific information within the annual report.-
 1
1 -
2
-
3
-
4
-
5
-
6
-
7
-
8
-
9
-
10
-
11
-
12
-
13
-
14
-
15
-
16
-
17
-
18
-
19
-
20
-
21
-
22
-
23
-
24
-
25
-
26
-
27
-
28
-
29
-
30
-
31
-
32
-
33
-
34
-
35
-
36
-
37
-
38
-
39
-
40
-
41
-
42
-
43
-
44
-
45
-
46
-
47
-
48
-
49
-
50
-
51
-
52
-
53
-
54
-
55
-
56
-
57
-
58
-
59
-
60
-
61
-
62
-
63
-
64
-
65
-
66
-
67
-
68
-
69
-
70
-
71
-
72
-
73
-
74
-
75
-
76
-
77
-
78
-
79
-
80
-
81
-
82
-
83
-
84
-
85
-
86
-
87
-
88
-
89
-
90
-
91
-
92
-
93
-
94
-
95
-
96
-
97
-
98
-
99
-
100
-
101
-
102
-
103
-
104
-
105
-
106
-
107
-
108
-
109
-
110
-
111
-
112
-
113
-
114
-
115
-
116
-
117
-
118
-
119
-
120
-
121
-
122
-
123
-
124
-
125
-
126
-
127
-
128
-
129
-
130
-
131
-
132
-
133
-
134
-
135
-
136
-
137
-
138
-
139
-
140
-
141
-
142
-
143
-
144
-
145
-
146
-
147
-
148
-
149
-
150
-
151
-
152
-
153
-
154
-
155
-
156
-
157
-
158
-
159
-
160
-
161
-
162
-
163
-
164
-
165
-
166
-
167
-
168
-
169
-
170
-
171
-
172
-
173
-
174
-
175
-
176
-
177
-
178
-
179
-
180
-
181
-
182
-
183
-
184
-
185
-
186
-
187
-
188
-
189
-
190
-
191
-
192
-
193
-
194
-
195
-
196
-
197
-
198
-
199
-
200
-
201
-
202
-
203
-
204
-
205
-
206
-
207
-
208
-
209
-
210
-
211
-
212
-
213
-
214
-
215
-
216
-
217
-
218
-
219
-
220
-
221
-
222
-
223
-
224
-
225
-
226
-
227
-
228
-
229
-
230
-
231
-
232
-
233
-
234
-
235
-
236
-
237
-
238
-
239
-
240
-
241
-
242
-
243
-
244
-
245
-
246
-
247
-
248
-
249
-
250
-
251
-
252
-
253
-
254
-
255
-
256
-
257
-
258
-
259
-
 260
260 -
 261
261 -
 262
262 -
 263
263 -
 264
264 -
 265
265 -
 266
266 -
 267
267 -
 268
268 -
 269
269 -
 270
270 -
 271
271 -
 272
272 -
 273
273 -
 274
274 -
 275
275 -
 276
276 -
 277
277 -
 278
278 -
 279
279 -
 280
280 -
281
-
282
-
283
-
284
-
285
-
286
-
287
-
288
-
289
-
290
-
291
-
292
-
293
-
294
 |
 |

NOTES TO THE CONSOLIDATED FINANCIAL STATEMENTS
ADDITIONAL DISCLOSURES
270
>>
///
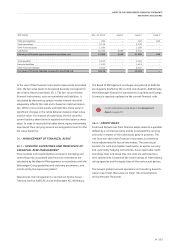
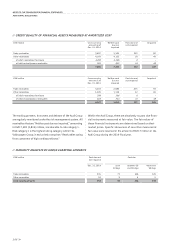
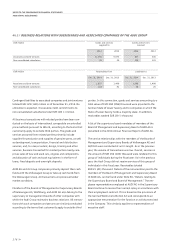
INTEREST RATE RISKS
Interest rate risks stem from changes in market rates, above
all for medium and long-term variable interest rate assets and
liabilities.
The Audi Group limits interest rate risks, particularly with regard
to the granting of loans and credit, by agreeing fixed interest
rates and also through interest rate swaps.
The risks associated with changing interest rates are presented
pursuant to IFRS 7 using sensitivity analyses. These involve
presenting the effects of hypothetical changes in market inter-
est rates as of the balance sheet date on interest payments,
interest income and expenses, and, where applicable, equity
and profit after tax.
///
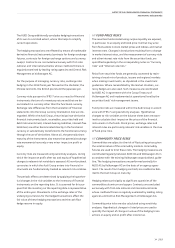
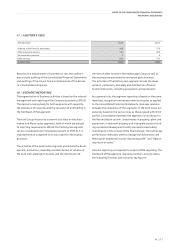
RESIDUAL VALUE RISKS
Residual value risks arise from hedging arrangements with the
retail trade or partner companies according to which, in the
context of buy-back obligations resulting from concluded lease
agreements, effects on profit caused by market-related
fluctuations in residual values are partly borne by the Audi Group.
The hedging arrangements are based on residual value recom-
mendations, as published by the residual value committee at
the time of the contract being concluded, and on current dealer
purchase values on the market at the time of the residual value
hedging being settled. The residual value recommendations
are based on the forecasts provided by various independent
institutions using transaction prices.
Residual value risks are also calculated using sensitivity analyses.
Hypothetical changes in the market prices of used cars as of
the balance sheet date are used to quantify the impact on
profit after tax.
//
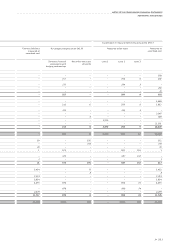
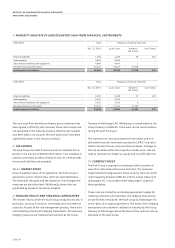
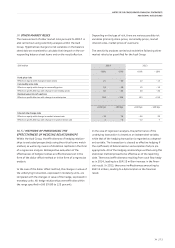
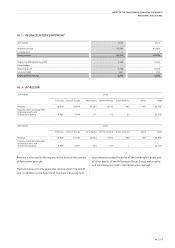
QUANTIFYING MARKET RISKS BY MEANS OF
SENSITIVITY ANALYSES
///
CURRENCY RISKS
If the functional currencies had in each case increased or
decreased in value by 10 percent compared with the other
currencies as of the balance sheet date, the following major
effects on the hedging provision in equity and on profit after
tax would have resulted with regard to the currency relations
referred to below.
EUR million
Dec. 31, 2014 Dec. 31, 2013
+10% – 10% +10% – 10%
EUR/JPY
Hedging reserve 80 – 80 79 – 79
Profit after tax –1 1 –2 2
EUR/USD
Hedging reserve 786 – 783 587 – 559
Profit after tax – 57 61 – 66 79
EUR/GBP
Hedging reserve 526 – 526 307 – 307
Profit after tax –1 1 0 0
EUR/CNY
Hedging reserve 381 – 381 245 – 245
Profit after tax – 48 48 – 61 61