Audi 2014 Annual Report Download - page 152
Download and view the complete annual report
Please find page 152 of the 2014 Audi annual report below. You can navigate through the pages in the report by either clicking on the pages listed below, or by using the keyword search tool below to find specific information within the annual report.-
 1
1 -
2
-
3
-
4
-
5
-
6
-
7
-
8
-
9
-
10
-
11
-
12
-
13
-
14
-
15
-
16
-
17
-
18
-
19
-
20
-
21
-
22
-
23
-
24
-
25
-
26
-
27
-
28
-
29
-
30
-
31
-
32
-
33
-
34
-
35
-
36
-
37
-
38
-
39
-
40
-
41
-
42
-
43
-
44
-
45
-
46
-
47
-
48
-
49
-
50
-
51
-
52
-
53
-
54
-
55
-
56
-
57
-
58
-
59
-
60
-
61
-
62
-
63
-
64
-
65
-
66
-
67
-
68
-
69
-
70
-
71
-
72
-
73
-
74
-
75
-
76
-
77
-
78
-
79
-
80
-
81
-
82
-
83
-
84
-
85
-
86
-
87
-
88
-
89
-
90
-
91
-
92
-
93
-
94
-
95
-
96
-
97
-
98
-
99
-
100
-
101
-
102
-
103
-
104
-
105
-
106
-
107
-
108
-
109
-
110
-
111
-
112
-
113
-
114
-
115
-
116
-
117
-
118
-
119
-
120
-
121
-
122
-
123
-
124
-
125
-
126
-
127
-
128
-
129
-
130
-
131
-
132
-
133
-
134
-
135
-
136
-
137
-
138
-
139
-
140
-
141
-
 142
142 -
 143
143 -
 144
144 -
 145
145 -
 146
146 -
 147
147 -
 148
148 -
 149
149 -
 150
150 -
 151
151 -
 152
152 -
 153
153 -
 154
154 -
 155
155 -
 156
156 -
 157
157 -
 158
158 -
 159
159 -
 160
160 -
 161
161 -
 162
162 -
163
-
164
-
165
-
166
-
167
-
168
-
169
-
170
-
171
-
172
-
173
-
174
-
175
-
176
-
177
-
178
-
179
-
180
-
181
-
182
-
183
-
184
-
185
-
186
-
187
-
188
-
189
-
190
-
191
-
192
-
193
-
194
-
195
-
196
-
197
-
198
-
199
-
200
-
201
-
202
-
203
-
204
-
205
-
206
-
207
-
208
-
209
-
210
-
211
-
212
-
213
-
214
-
215
-
216
-
217
-
218
-
219
-
220
-
221
-
222
-
223
-
224
-
225
-
226
-
227
-
228
-
229
-
230
-
231
-
232
-
233
-
234
-
235
-
236
-
237
-
238
-
239
-
240
-
241
-
242
-
243
-
244
-
245
-
246
-
247
-
248
-
249
-
250
-
251
-
252
-
253
-
254
-
255
-
256
-
257
-
258
-
259
-
260
-
261
-
262
-
263
-
264
-
265
-
266
-
267
-
268
-
269
-
270
-
271
-
272
-
273
-
274
-
275
-
276
-
277
-
278
-
279
-
280
-
281
-
282
-
283
-
284
-
285
-
286
-
287
-
288
-
289
-
290
-
291
-
292
-
293
-
294
 |
 |

BASIS OF THE AUDI GROUP
MANAGEMENT SYSTEM // SHARES
152
>>
drawn up for the full year and also for any next three-month
period. Measures developed to reflect the prevailing opportunity
and risk position are taken into account on an ongoing basis.
Management over the course of the year is thus all about con-
tinuously adapting to internal and external circumstances. At
the same time, the current forecast constitutes the basis for
the next medium-term and budget planning.
/
KEY PERFORMANCE INDICATORS OF
GROUP MANAGEMENT
The basis for the management of the Audi Group is a value-
oriented corporate management approach in combination with
the following key performance indicators, which have been
derived from the strategic goals:
>Deliveries to customers
>Revenue
>Operating profit
>Operating return on sales
>Return on investment (ROI)
>Net cash flow
>Ratio of investments in property, plant and equipment
The non-financial indicator deliveries to customers expresses the
number of new vehicles handed over to customers. This perfor-
mance indicator reflects customer demand for our products.
Increasing the deliveries to customers goes in tandem with the
strategic goal of continuous growth to more than 2 million Audi
vehicles delivered. Growing demand for our products has a ma-
jor impact on the development of unit sales and production, and
thus on the capacity utilization of our locations.
Revenue is a financial key performance indicator of the
Audi Group and the financial reflection of our market success.
Operating profit is the balance of revenue and resources
deployed, along with the other operating result. It reveals
our fundamental operational activity and the economic per-
formance of our core business area. The ratio of operating
profit achieved to revenue produces the operating return on
sales, which we have also defined as a financial key perfor-
mance indicator of the Audi Group.
Return on investment (R0I) evaluates the return and the
capital employed for investment projects. We obtain this
indicator by determining the ratio of operating profit after
tax to average invested assets.
Net cash flow represents the cash inflow from operating activi-
ties less investment spending from business operations, with-
out consideration of cash deposits, and serves as an indicator
of our Company’s economic stability and level of self-financing.
The ratio of investments in property, plant and equipment is
an indicator of our Company’s innovative strength. The total
volume of investments in property, plant and equipment and
of intangible assets (excluding capitalized development costs)
is considered in relation to revenue. Capital investment in
essence comprises financial resources for updating and
expanding the product range, for increasing our capacity, as
well as for improving the Audi Group’s production processes.
For further information and explanations on
“Deliveries and distribution” and on the
“Financial performance indicators,” please refer to
pages 166 ff. and 171 ff.
We describe other non-financial key figures as well as
corporate responsibility goals and measures on
pages 178 ff.
SHARES
/
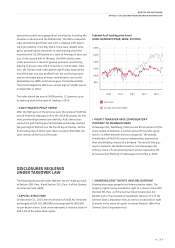
STOCK MARKET DEVELOPMENTS
The performance of the German Share Index (DAX) in the past
fiscal year fell short of repeating its dynamic progress of 2012
and 2013.
At the start of the year, however, the capital market environ-
ment had looked brighter thanks to the improving economic
outlook. The picture soon changed, with market players
focusing on currency turbulence in a number of emerging