Audi 2014 Annual Report Download - page 256
Download and view the complete annual report
Please find page 256 of the 2014 Audi annual report below. You can navigate through the pages in the report by either clicking on the pages listed below, or by using the keyword search tool below to find specific information within the annual report.-
 1
1 -
2
-
3
-
4
-
5
-
6
-
7
-
8
-
9
-
10
-
11
-
12
-
13
-
14
-
15
-
16
-
17
-
18
-
19
-
20
-
21
-
22
-
23
-
24
-
25
-
26
-
27
-
28
-
29
-
30
-
31
-
32
-
33
-
34
-
35
-
36
-
37
-
38
-
39
-
40
-
41
-
42
-
43
-
44
-
45
-
46
-
47
-
48
-
49
-
50
-
51
-
52
-
53
-
54
-
55
-
56
-
57
-
58
-
59
-
60
-
61
-
62
-
63
-
64
-
65
-
66
-
67
-
68
-
69
-
70
-
71
-
72
-
73
-
74
-
75
-
76
-
77
-
78
-
79
-
80
-
81
-
82
-
83
-
84
-
85
-
86
-
87
-
88
-
89
-
90
-
91
-
92
-
93
-
94
-
95
-
96
-
97
-
98
-
99
-
100
-
101
-
102
-
103
-
104
-
105
-
106
-
107
-
108
-
109
-
110
-
111
-
112
-
113
-
114
-
115
-
116
-
117
-
118
-
119
-
120
-
121
-
122
-
123
-
124
-
125
-
126
-
127
-
128
-
129
-
130
-
131
-
132
-
133
-
134
-
135
-
136
-
137
-
138
-
139
-
140
-
141
-
142
-
143
-
144
-
145
-
146
-
147
-
148
-
149
-
150
-
151
-
152
-
153
-
154
-
155
-
156
-
157
-
158
-
159
-
160
-
161
-
162
-
163
-
164
-
165
-
166
-
167
-
168
-
169
-
170
-
171
-
172
-
173
-
174
-
175
-
176
-
177
-
178
-
179
-
180
-
181
-
182
-
183
-
184
-
185
-
186
-
187
-
188
-
189
-
190
-
191
-
192
-
193
-
194
-
195
-
196
-
197
-
198
-
199
-
200
-
201
-
202
-
203
-
204
-
205
-
206
-
207
-
208
-
209
-
210
-
211
-
212
-
213
-
214
-
215
-
216
-
217
-
218
-
219
-
220
-
221
-
222
-
223
-
224
-
225
-
226
-
227
-
228
-
229
-
230
-
231
-
232
-
233
-
234
-
235
-
236
-
237
-
238
-
239
-
240
-
241
-
242
-
243
-
244
-
245
-
 246
246 -
 247
247 -
 248
248 -
 249
249 -
 250
250 -
 251
251 -
 252
252 -
 253
253 -
 254
254 -
 255
255 -
 256
256 -
 257
257 -
 258
258 -
 259
259 -
 260
260 -
 261
261 -
 262
262 -
 263
263 -
 264
264 -
 265
265 -
 266
266 -
267
-
268
-
269
-
270
-
271
-
272
-
273
-
274
-
275
-
276
-
277
-
278
-
279
-
280
-
281
-
282
-
283
-
284
-
285
-
286
-
287
-
288
-
289
-
290
-
291
-
292
-
293
-
294
 |
 |

NOTES TO THE CONSOLIDATED FINANCIAL STATEMENTS
NOTES TO THE BALANCE SHEET
256
>>
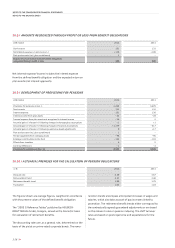
30.8 /
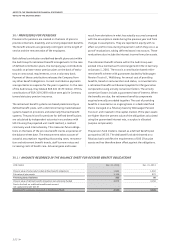
AMOUNTS RECOGNIZED THROUGH PROFIT OR LOSS FROM BENEFIT OBLIGATIONS
EUR million
2014 2013
Service costs 131 132
Net interest expense (+) and income (–) +116 + 108
Past service costs (incl. plan curtailment) 1 –
Balance of amounts from defined benefit obligations
recognized through profit or loss 248 240
Net interest expense/income includes the interest expense
from the defined benefit obligation and the expected return on
plan assets (net interest approach).
30.9 /
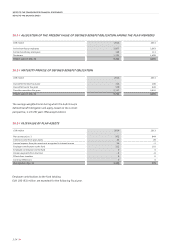
DEVELOPMENT OF PROVISIONS FOR PENSIONS
EUR million
2014 2013
Provisions for pensions on Jan. 1 3,209 3,470
Service costs 131 132
Interest expense 151 136
Interest income from plan assets – 35 – 28
Income/expense from plan assets not recognized in interest income – 36 2
Actuarial gains (–)/losses (+) following changes in demographic assumptions +1 +1
Actuarial gains (–)/losses (+) following changes in financial assumptions + 1,379 – 317
Actuarial gains (–)/losses (+) following experience-based adjustments 0 + 17
Past service costs (incl. plan curtailment) 1 –
Pension payments from company assets – 98 – 95
Employer contributions to the fund – 122 – 110
Effects from transfers 4 5
Currency differences –1 –4
Provisions for pensions on Dec. 31 4,585 3,209
30.10 /
ACTUARIAL PREMISES FOR THE CALCULATION OF PENSION OBLIGATIONS
in %
2014 2013
Discount rate 2.29 3.67
Remuneration trend 3.57 3.46
Retirement benefit trend 1.80 1.79
Fluctuation 1.02 1.03
The figures shown are average figures, weighted in accordance
with the present values of the defined benefit obligation.
The “2005 G Reference Tables” published by HEUBECK-
RICHTTAFELN-GmbH, Cologne, served as the biometric basis
for calculation of retirement benefits.
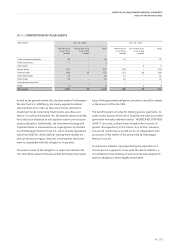
The discounting rates are, as a general rule, determined on the
basis of the yields on prime-rated corporate bonds. The remu-
neration trends encompass anticipated increases in wages and
salaries, which also take account of pay increases linked to
promotion. The retirement benefit trends either correspond to
the contractually agreed guaranteed adjustments or are based
on the relevant rules on pension indexing. The staff turnover
rates are based on past experience and expectations for the
future.