Audi 2014 Annual Report Download - page 238
Download and view the complete annual report
Please find page 238 of the 2014 Audi annual report below. You can navigate through the pages in the report by either clicking on the pages listed below, or by using the keyword search tool below to find specific information within the annual report.-
 1
1 -
2
-
3
-
4
-
5
-
6
-
7
-
8
-
9
-
10
-
11
-
12
-
13
-
14
-
15
-
16
-
17
-
18
-
19
-
20
-
21
-
22
-
23
-
24
-
25
-
26
-
27
-
28
-
29
-
30
-
31
-
32
-
33
-
34
-
35
-
36
-
37
-
38
-
39
-
40
-
41
-
42
-
43
-
44
-
45
-
46
-
47
-
48
-
49
-
50
-
51
-
52
-
53
-
54
-
55
-
56
-
57
-
58
-
59
-
60
-
61
-
62
-
63
-
64
-
65
-
66
-
67
-
68
-
69
-
70
-
71
-
72
-
73
-
74
-
75
-
76
-
77
-
78
-
79
-
80
-
81
-
82
-
83
-
84
-
85
-
86
-
87
-
88
-
89
-
90
-
91
-
92
-
93
-
94
-
95
-
96
-
97
-
98
-
99
-
100
-
101
-
102
-
103
-
104
-
105
-
106
-
107
-
108
-
109
-
110
-
111
-
112
-
113
-
114
-
115
-
116
-
117
-
118
-
119
-
120
-
121
-
122
-
123
-
124
-
125
-
126
-
127
-
128
-
129
-
130
-
131
-
132
-
133
-
134
-
135
-
136
-
137
-
138
-
139
-
140
-
141
-
142
-
143
-
144
-
145
-
146
-
147
-
148
-
149
-
150
-
151
-
152
-
153
-
154
-
155
-
156
-
157
-
158
-
159
-
160
-
161
-
162
-
163
-
164
-
165
-
166
-
167
-
168
-
169
-
170
-
171
-
172
-
173
-
174
-
175
-
176
-
177
-
178
-
179
-
180
-
181
-
182
-
183
-
184
-
185
-
186
-
187
-
188
-
189
-
190
-
191
-
192
-
193
-
194
-
195
-
196
-
197
-
198
-
199
-
200
-
201
-
202
-
203
-
204
-
205
-
206
-
207
-
208
-
209
-
210
-
211
-
212
-
213
-
214
-
215
-
216
-
217
-
218
-
219
-
220
-
221
-
222
-
223
-
224
-
225
-
226
-
227
-
 228
228 -
 229
229 -
 230
230 -
 231
231 -
 232
232 -
 233
233 -
 234
234 -
 235
235 -
 236
236 -
 237
237 -
 238
238 -
 239
239 -
 240
240 -
 241
241 -
 242
242 -
 243
243 -
 244
244 -
 245
245 -
 246
246 -
 247
247 -
 248
248 -
249
-
250
-
251
-
252
-
253
-
254
-
255
-
256
-
257
-
258
-
259
-
260
-
261
-
262
-
263
-
264
-
265
-
266
-
267
-
268
-
269
-
270
-
271
-
272
-
273
-
274
-
275
-
276
-
277
-
278
-
279
-
280
-
281
-
282
-
283
-
284
-
285
-
286
-
287
-
288
-
289
-
290
-
291
-
292
-
293
-
294
 |
 |
NOTES TO THE CONSOLIDATED FINANCIAL STATEMENTS
NOTES TO THE INCOME STATEMENT
238
>>
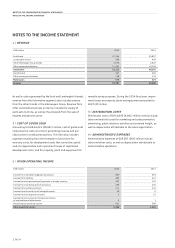
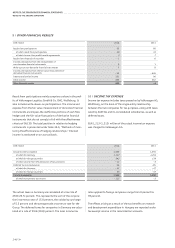
NOTES TO THE INCOME STATEMENT
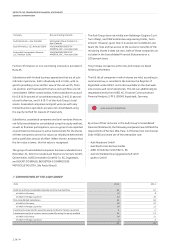
1 /
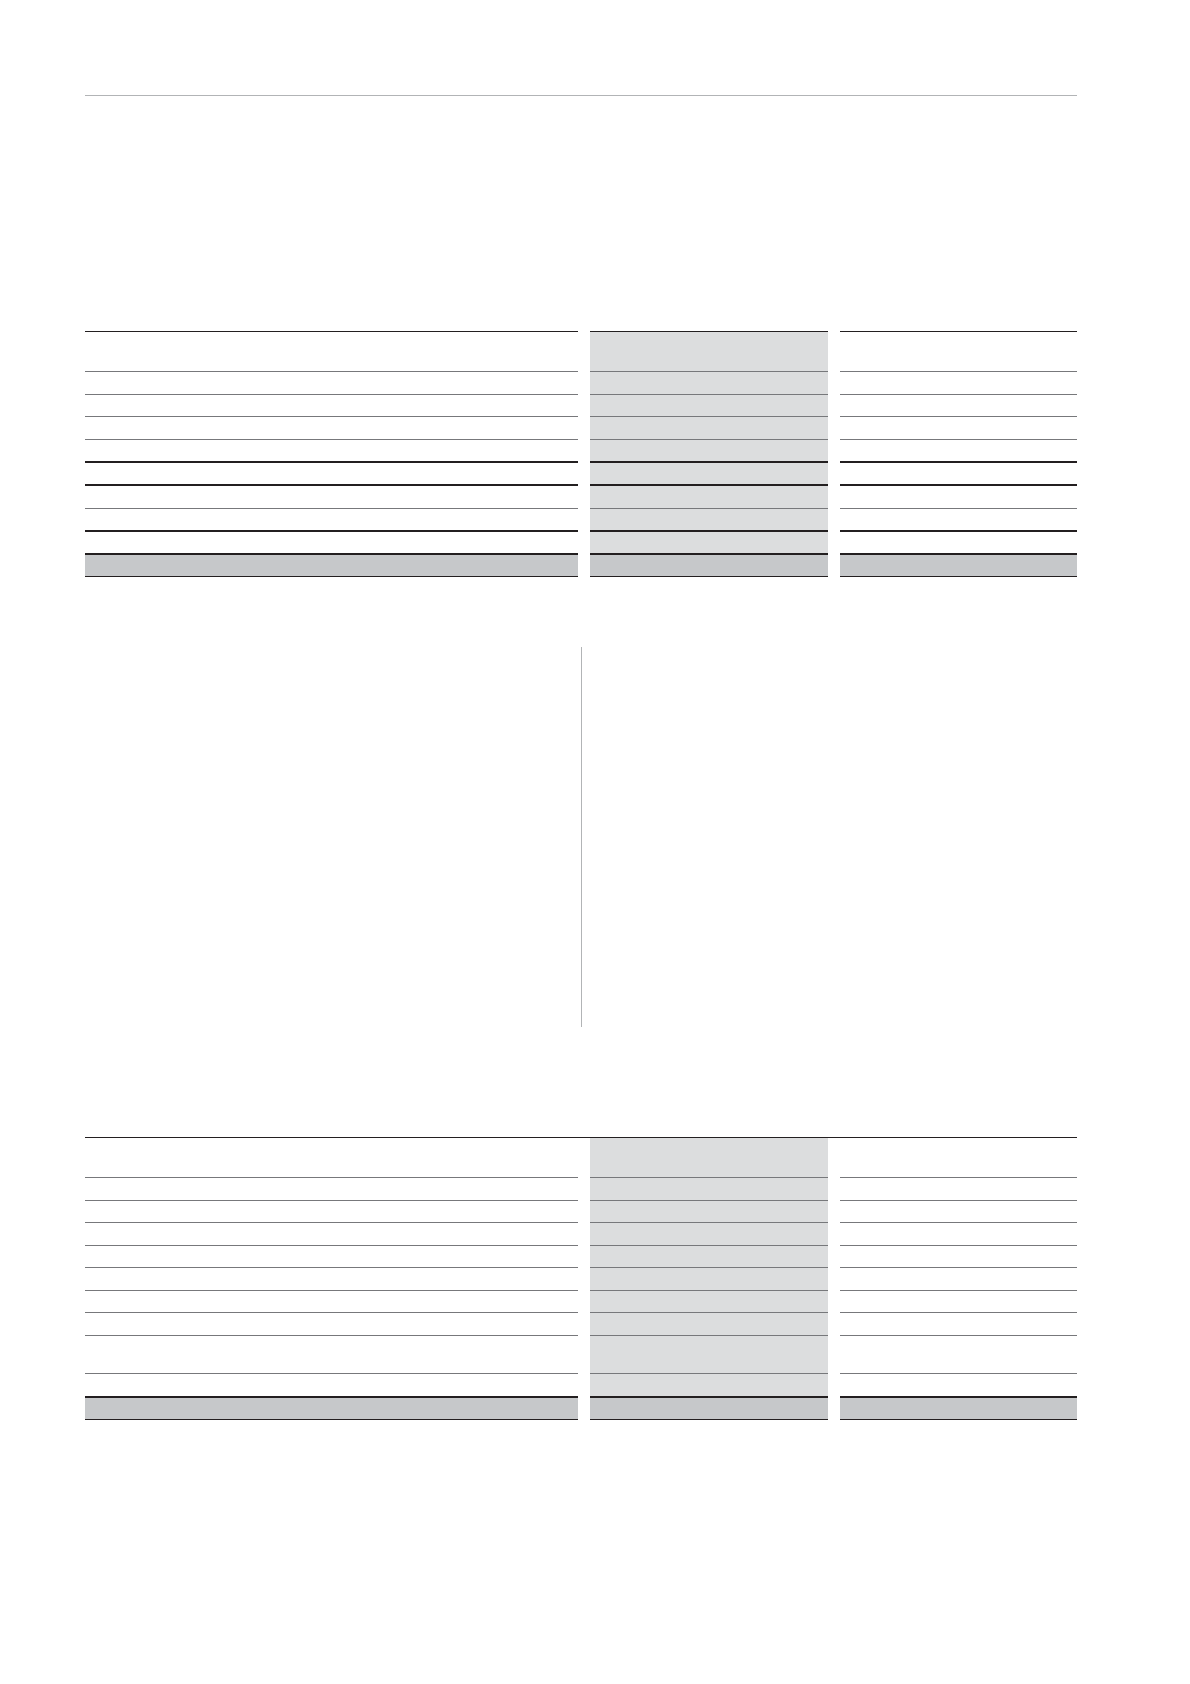
REVENUE
EUR million
2014 2013
Audi brand 37,784 35,827
Lamborghini brand 586 458
Other Volkswagen Group brands 3,076 2,827
Other automotive business 11,767 10,194
Automotive 53,213 49,307
Ducati brand 457 450
Other motorcycles business 118 123
Motorcycles 575 573
Revenue 53,787 49,880
As well as sales generated by the Audi and Lamborghini brands,
revenue from the Automotive segment also includes revenue
from the other brands in the Volkswagen Group. Revenue from
other automotive business primarily includes the supply of
parts sets to China, as well as the proceeds from the sale of
engines and genuine parts.
2 /
COST OF GOODS SOLD
Amounting to EUR 44,415 (40,691) million, cost of goods sold
comprises the costs incurred in generating revenue and pur-
chase prices in trading transactions. This item also includes
expenses resulting from the formation of provisions for
warranty costs, for development costs that cannot be capital-
ized, for depreciation and impairment losses of capitalized
development costs, and for property, plant and equipment for
manufacturing purposes. During the 2014 fiscal year, impair-
ment losses on property, plant and equipment amounted to
EUR 5 (0) million.
3 /
DISTRIBUTION COSTS
Distribution costs of EUR 4,895 (4,641) million mainly include
labor and material costs for marketing and sales promotion,
advertising, public relations activities and outward freight, as
well as depreciation attributable to the sales organization.
4 /
ADMINISTRATIVE EXPENSES
Administrative expenses of EUR 587 (566) million include
labor and other costs, as well as depreciation attributable to
administrative operations.
5 /
OTHER OPERATING INCOME
EUR million
2014 2013
Income from derivative hedging transactions 609 493
Income from rebilling 485 473
Income from the processing of payments in foreign currency 297 142
Income from the dissolution of provisions 289 240
Income from ancillary business 211 223
Income from the write-up of intangible assets 20 0
Income from the disposal of assets 5 12
Income from the reversal of impairment losses
of receivables and other assets 2 1
Miscellaneous operating income 411 368
Other operating income 2,329 1,952