Audi 2014 Annual Report Download - page 264
Download and view the complete annual report
Please find page 264 of the 2014 Audi annual report below. You can navigate through the pages in the report by either clicking on the pages listed below, or by using the keyword search tool below to find specific information within the annual report.-
 1
1 -
2
-
3
-
4
-
5
-
6
-
7
-
8
-
9
-
10
-
11
-
12
-
13
-
14
-
15
-
16
-
17
-
18
-
19
-
20
-
21
-
22
-
23
-
24
-
25
-
26
-
27
-
28
-
29
-
30
-
31
-
32
-
33
-
34
-
35
-
36
-
37
-
38
-
39
-
40
-
41
-
42
-
43
-
44
-
45
-
46
-
47
-
48
-
49
-
50
-
51
-
52
-
53
-
54
-
55
-
56
-
57
-
58
-
59
-
60
-
61
-
62
-
63
-
64
-
65
-
66
-
67
-
68
-
69
-
70
-
71
-
72
-
73
-
74
-
75
-
76
-
77
-
78
-
79
-
80
-
81
-
82
-
83
-
84
-
85
-
86
-
87
-
88
-
89
-
90
-
91
-
92
-
93
-
94
-
95
-
96
-
97
-
98
-
99
-
100
-
101
-
102
-
103
-
104
-
105
-
106
-
107
-
108
-
109
-
110
-
111
-
112
-
113
-
114
-
115
-
116
-
117
-
118
-
119
-
120
-
121
-
122
-
123
-
124
-
125
-
126
-
127
-
128
-
129
-
130
-
131
-
132
-
133
-
134
-
135
-
136
-
137
-
138
-
139
-
140
-
141
-
142
-
143
-
144
-
145
-
146
-
147
-
148
-
149
-
150
-
151
-
152
-
153
-
154
-
155
-
156
-
157
-
158
-
159
-
160
-
161
-
162
-
163
-
164
-
165
-
166
-
167
-
168
-
169
-
170
-
171
-
172
-
173
-
174
-
175
-
176
-
177
-
178
-
179
-
180
-
181
-
182
-
183
-
184
-
185
-
186
-
187
-
188
-
189
-
190
-
191
-
192
-
193
-
194
-
195
-
196
-
197
-
198
-
199
-
200
-
201
-
202
-
203
-
204
-
205
-
206
-
207
-
208
-
209
-
210
-
211
-
212
-
213
-
214
-
215
-
216
-
217
-
218
-
219
-
220
-
221
-
222
-
223
-
224
-
225
-
226
-
227
-
228
-
229
-
230
-
231
-
232
-
233
-
234
-
235
-
236
-
237
-
238
-
239
-
240
-
241
-
242
-
243
-
244
-
245
-
246
-
247
-
248
-
249
-
250
-
251
-
252
-
253
-
 254
254 -
 255
255 -
 256
256 -
 257
257 -
 258
258 -
 259
259 -
 260
260 -
 261
261 -
 262
262 -
 263
263 -
 264
264 -
 265
265 -
 266
266 -
 267
267 -
 268
268 -
 269
269 -
 270
270 -
 271
271 -
 272
272 -
 273
273 -
 274
274 -
275
-
276
-
277
-
278
-
279
-
280
-
281
-
282
-
283
-
284
-
285
-
286
-
287
-
288
-
289
-
290
-
291
-
292
-
293
-
294
 |
 |

NOTES TO THE CONSOLIDATED FINANCIAL STATEMENTS
ADDITIONAL DISCLOSURES
264
>>
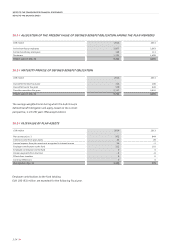
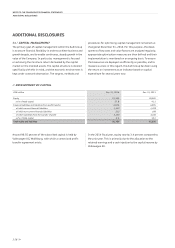
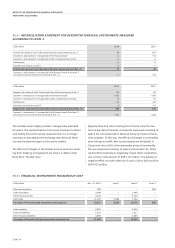
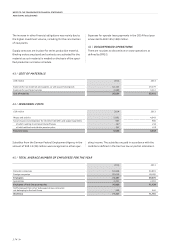
35.4 /
RECONCILIATION STATEMENT FOR DERIVATIVE FINANCIAL INSTRUMENTS MEASURED
ACCORDING TO LEVEL 3
EUR million
2014 2013
Positive fair values of level 3 derivative financial instruments as of Jan. 1 30 103
Income (+) and expense (–) recognized in the financial result +1 – 62
Income (+) and expense (–) recognized in other comprehensive income +2 –1
Settlements – 11 –8
Transfer from level 3 to level 2 –4 –3
Positive fair values of level 3 derivative financial instruments as of Dec. 31 17 30
Income (+) and expense (–) recognized in the financial result from level 3
derivative financial instruments still held at Dec. 31 +1 – 62
EUR million
2014 2013
Negative fair values of level 3 derivative financial instruments as of Jan. 1 176 20
Income (–) and expense (+) recognized in the financial result + 101 + 180
Income (–) and expense (+) recognized in other comprehensive income +3 +6
Settlements – 47 – 20
Transfer from level 3 to level 2 –6 – 10
Negative fair values of level 3 derivative financial instruments as of Dec. 31 227 176
Income (–) and expense (+) recognized in the financial result from level 3
derivative financial instruments still held at Dec. 31 + 101 + 180
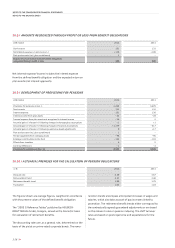
The residual value hedging model is categorically allocated
to level 3. The reclassifications from level 3 to level 2 contain
commodity futures for whose measurement it is no longer
necessary to extrapolate the exchange rates because these
can now be observed again on the active market.
The effects of changes in the market price of used cars result-
ing from hedging arrangements are shown in detail under
Note 36.4, “Market risks.”
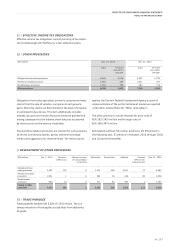
Opportunities and risks resulting from the fair value fluctua-
tions in derivative financial instruments measured according to
level 3 are calculated within the Audi Group by means of sensi-
tivity analyses. In this way, the effects of changes in commodity
price listings on profit after tax and equity are simulated. A
10 percent rise or fall in the commodity prices of commodity
futures measured according to level 3 at December 31, 2014
would either positively or negatively impact other comprehen-
sive income in the amount of EUR 1 (3) million. The positive or
negative effect on profit after tax of such a rise or fall would be
EUR 6 (2) million.
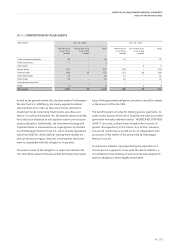
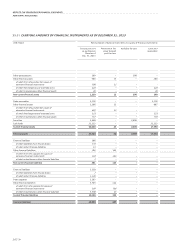
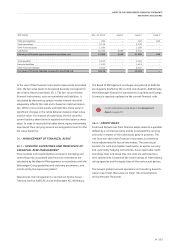
35.5 /
FINANCIAL INSTRUMENTS MEASURED AT COST
EUR million
Dec. 31, 2014 Level 1 Level 2 Level 3
Other participations 268 – – 268
Trade receivables 3,648 – 3,648 –
Other financial assets 4,120 – 4,120 –
Cash funds 11,391 3,689 7,702 –
Fair values of financial assets measured at amortized cost 19,427 3,689 15,470 268
Trade payables 5,824 – 5,824 –
Financial liabilities 1,637 – 1,637 –
Other financial liabilities 4,480 – 4,480 –
Fair values of financial liabilities measured at amortized cost 11,942 – 11,942 –