Audi 2014 Annual Report Download - page 171
Download and view the complete annual report
Please find page 171 of the 2014 Audi annual report below. You can navigate through the pages in the report by either clicking on the pages listed below, or by using the keyword search tool below to find specific information within the annual report.-
 1
1 -
2
-
3
-
4
-
5
-
6
-
7
-
8
-
9
-
10
-
11
-
12
-
13
-
14
-
15
-
16
-
17
-
18
-
19
-
20
-
21
-
22
-
23
-
24
-
25
-
26
-
27
-
28
-
29
-
30
-
31
-
32
-
33
-
34
-
35
-
36
-
37
-
38
-
39
-
40
-
41
-
42
-
43
-
44
-
45
-
46
-
47
-
48
-
49
-
50
-
51
-
52
-
53
-
54
-
55
-
56
-
57
-
58
-
59
-
60
-
61
-
62
-
63
-
64
-
65
-
66
-
67
-
68
-
69
-
70
-
71
-
72
-
73
-
74
-
75
-
76
-
77
-
78
-
79
-
80
-
81
-
82
-
83
-
84
-
85
-
86
-
87
-
88
-
89
-
90
-
91
-
92
-
93
-
94
-
95
-
96
-
97
-
98
-
99
-
100
-
101
-
102
-
103
-
104
-
105
-
106
-
107
-
108
-
109
-
110
-
111
-
112
-
113
-
114
-
115
-
116
-
117
-
118
-
119
-
120
-
121
-
122
-
123
-
124
-
125
-
126
-
127
-
128
-
129
-
130
-
131
-
132
-
133
-
134
-
135
-
136
-
137
-
138
-
139
-
140
-
141
-
142
-
143
-
144
-
145
-
146
-
147
-
148
-
149
-
150
-
151
-
152
-
153
-
154
-
155
-
156
-
157
-
158
-
159
-
160
-
 161
161 -
 162
162 -
 163
163 -
 164
164 -
 165
165 -
 166
166 -
 167
167 -
 168
168 -
 169
169 -
 170
170 -
 171
171 -
 172
172 -
 173
173 -
 174
174 -
 175
175 -
 176
176 -
 177
177 -
 178
178 -
 179
179 -
 180
180 -
 181
181 -
182
-
183
-
184
-
185
-
186
-
187
-
188
-
189
-
190
-
191
-
192
-
193
-
194
-
195
-
196
-
197
-
198
-
199
-
200
-
201
-
202
-
203
-
204
-
205
-
206
-
207
-
208
-
209
-
210
-
211
-
212
-
213
-
214
-
215
-
216
-
217
-
218
-
219
-
220
-
221
-
222
-
223
-
224
-
225
-
226
-
227
-
228
-
229
-
230
-
231
-
232
-
233
-
234
-
235
-
236
-
237
-
238
-
239
-
240
-
241
-
242
-
243
-
244
-
245
-
246
-
247
-
248
-
249
-
250
-
251
-
252
-
253
-
254
-
255
-
256
-
257
-
258
-
259
-
260
-
261
-
262
-
263
-
264
-
265
-
266
-
267
-
268
-
269
-
270
-
271
-
272
-
273
-
274
-
275
-
276
-
277
-
278
-
279
-
280
-
281
-
282
-
283
-
284
-
285
-
286
-
287
-
288
-
289
-
290
-
291
-
292
-
293
-
294
 |
 |

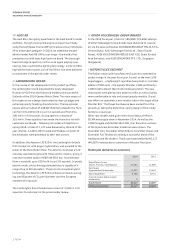
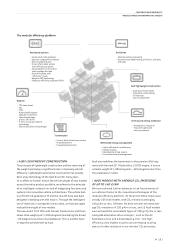
FINANCIAL PERFORMANCE INDICATORS
FINANCIAL PERFORMANCE
>>
171
FINANCIAL PERFORMANCE
The Audi Group increased its revenue by 7.8 percent to
EUR 53,787 (49,880) million in the 2014 fiscal year. Within
this total, the Automotive segment generated revenue of
EUR 53,214 (49,310) million. We generated EUR 37,784
(35,827) million in revenue through sales of vehicles of the
core brand Audi.
The main revenue driver was the new A3 car line, especially
after the gradual market introduction of the A3 Sedan. Sus-
tained high demand for our SUV models also impacted revenue
performance positively.
Revenue from the sale of vehicles of the Lamborghini brand
saw a year-on-year increase to EUR 586 (458) million, in par-
ticular thanks to high demand for the new Huracán.
In addition to models of the Audi and Lamborghini brands, the
Audi Group sells vehicles of the Bentley, SEAT, Škoda, VW
Passenger Cars and VW Commercial Vehicles brands through
the Group-owned sales subsidiaries VOLKSWAGEN GROUP
ITALIA S.P.A., Verona (Italy), Audi Volkswagen Korea Ltd.,
Seoul (South Korea), AUDI VOLKSWAGEN MIDDLE EAST FZE,
Dubai (United Arab Emirates), and AUDI SINGAPORE PTE. LTD.,
Singapore (Singapore). The increasing stabilization of the
passenger car market in Western European countries outside
Germany played a major part in the rise in revenue from the
sale of other-brand vehicles to EUR 3,076 (2,827) million.
Revenue from other automotive business increased to
EUR 11,767 (10,194) million, mainly by stepping up deliver-
ies of parts sets for local assembly in China.
In the Motorcycles segment, the Audi Group generated reve-
nue of EUR 575 (573) million in the year under review.
As a result of our expanded production volume, the cost of
goods sold for the Audi Group climbed to EUR 44,415 (40,691)
million. The gross profit of the Audi Group thus reached
EUR 9,372 (9,188) million in the past fiscal year.
The substantial increase in our deliveries and market introduc-
tions of a large number of models raised distribution costs for
the Audi Group to EUR 4,895 (4,641) million. Administrative
expenses rose to EUR 587 (566) million as a result of the gen-
eral growth of the Audi Group. Other operating result im-
proved to EUR 1,260 (1,049) million.
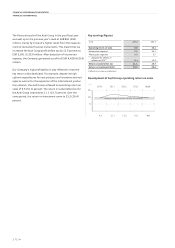
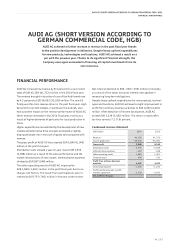
Operating profit for the Audi Group reached EUR 5,150 (5,030)
million and thus improved compared with the previous year
despite higher research and development costs for forward-
looking technologies and new products as well as high upfront
expenditures for the expansion of our international production
network. Within this total, our Automotive segment achieved
an operating profit of EUR 5,127 (4,997) million. As a result of
mix effects and expenditures for the expansion of internation-
al manufacturing structures, as well as taking account of addi-
tional depreciation due to the revaluation of assets and liabili-
ties for purchase price allocation, the Motorcycles segment
generated an operating profit of EUR 23 (33) million. Adjusted
for the effects of purchase price allocation, an operating profit
of EUR 48 (59) million was achieved.
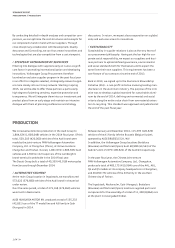
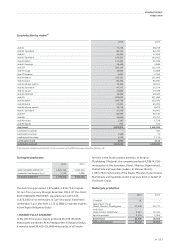
Development of Audi Group operating profit
6,000
4,500
3,000
1,500
2011 201320122010 2014
3,340 5,3655,348 5,1505,030
EUR million
FINANCIAL PERFORMANCE INDICATORS
The Audi Group maintained its course of growth in the 2014 fiscal year with a
further increase in revenue. Despite substantial upfront expenditures for
pioneering technologies and new products as well as the expansion of the
international production network, the Company achieved an operating return
on sales of 9.6 percent, towards the upper end of the strategic target corridor
of 8 to 10 percent.