AT&T Wireless 2009 Annual Report Download - page 92
Download and view the complete annual report
Please find page 92 of the 2009 AT&T Wireless annual report below. You can navigate through the pages in the report by either clicking on the pages listed below, or by using the keyword search tool below to find specific information within the annual report.-
 1
1 -
2
-
3
-
4
-
5
-
6
-
7
-
8
-
9
-
10
-
11
-
12
-
13
-
14
-
15
-
16
-
17
-
18
-
19
-
20
-
21
-
22
-
23
-
24
-
25
-
26
-
27
-
28
-
29
-
30
-
31
-
32
-
33
-
34
-
35
-
36
-
37
-
38
-
39
-
40
-
41
-
42
-
43
-
44
-
45
-
46
-
47
-
48
-
49
-
50
-
51
-
52
-
53
-
54
-
55
-
56
-
57
-
58
-
59
-
60
-
61
-
62
-
63
-
64
-
65
-
66
-
67
-
68
-
69
-
70
-
71
-
72
-
73
-
74
-
75
-
76
-
77
-
78
-
79
-
80
-
81
-
 82
82 -
 83
83 -
 84
84 -
 85
85 -
 86
86 -
 87
87 -
 88
88 -
 89
89 -
 90
90 -
 91
91 -
 92
92 -
 93
93 -
 94
94 -
 95
95 -
 96
96 -
 97
97 -
 98
98 -
 99
99 -
 100
100
 |
 |

Notes to Consolidated Financial Statements (continued)
Dollars in millions except per share amounts
90 AT&T 09 AR
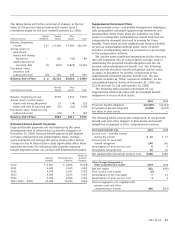
A summary of the status of our nonvested stock units, which
includes performance stock units as of December 31, 2009, and
changes during the year then ended is presented as follows
(shares in millions):
Weighted-Average
Nonvested Stock Units Shares Grant-Date Fair Value
Nonvested at January 1, 2009 24 $ 35.18
Granted 16 24.80
Vested (14) 34.51
Forfeited — 28.67
Nonvested at December 31, 2009 26 $26.48
As of December 31, 2009, there was $365 of total unrecognized
compensation cost related to nonvested share-based payment
arrangements granted. That cost is expected to be recognized
over a weighted-average period of 1.88 years. The total fair
value of shares vested during the year was $471 for 2009,
compared to $554 for 2008 and $345 for 2007.
NOTE 13. STOCKHOLDERS’ EQUITY
From time to time, we repurchase shares of common stock
for distribution through our employee benefit plans or in
connection with certain acquisitions. In December 2007,
the Board of Directors authorized the repurchase of
up to 400 million shares of our common stock. This
authorization replaced previous authorizations and
expired on December 31, 2009. As of December 31, 2009,
we had repurchased approximately 164 million shares
under this program.
During the Annual Meeting of Shareholders in April 2009,
shareholders approved the increase of authorized common
shares of AT&T stock from 7 billion to 14 billion, with no
change to the currently authorized 10 million preferred shares
of AT&T stock. As of December 31, 2009 and 2008, no
preferred shares were outstanding.
In December 2009, the Company declared its quarterly
dividend, which reflected an increase in the amount per share
of common stock from $0.41 to $0.42.
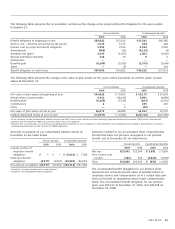
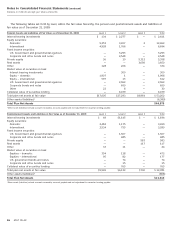
NOTE 14. ADDITIONAL FINANCIAL INFORMATION
December 31,
Consolidated Balance Sheets 2009 2008
Accounts payable and accrued liabilities:
Accounts payable $ 7,514 $ 6,921
Accrued rents and other 3,335 4,437
Accrued payroll and commissions 2,430 2,401
Deferred directory revenue 1,491 1,984
Accrued interest 1,717 1,471
Compensated future absences 563 609
Current portion of employee
benefit obligation 2,021 729
Other 1,928 1,480
Total accounts payable and
accrued liabilities $20,999 $20,032
Deferred compensation (included in
Other noncurrent liabilities) $ 1,633 $ 1,648
Consolidated Statements of Income 2009 2008 2007
Advertising expense $2,797 $3,073 $3,430
Interest expense incurred $4,119 $4,049 $3,678
Capitalized interest (740) (659) (171)
Total interest expense $3,379 $3,390 $3,507
Consolidated Statements of Cash Flows 2009 2008 2007
Cash paid during the year for:
Interest $3,873 $3,727 $3,445
Income taxes, net of refunds 4,471 5,307 4,013
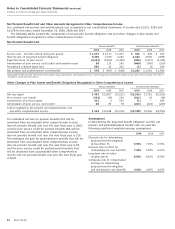
Consolidated Statements of
Changes in Stockholders’ Equity 2009 2008 2007
Accumulated other comprehensive
income (loss) is composed of
the following components,
net of taxes, at December 31:
Foreign currency
translation adjustment $ (761) $ (912) $(469)
Unrealized gains on
securities 324 100 375
Unrealized gains (losses) on
cash flow hedges 142 (483) (226)
Defined benefit
postretirement plans (14,112) (15,761) (59)
Other (1) (1) (1)
Accumulated other
comprehensive (loss) $(14,408) $(17,057) $(380)
No customer accounted for more than 10% of consolidated
revenues in 2009, 2008 or 2007.
A majority of our employees are represented by labor
unions as of year-end 2009.
NOTE 15. CONTINGENT LIABILITIES
In addition to issues specifically discussed elsewhere, we are
party to numerous lawsuits, regulatory proceedings and other
matters arising in the ordinary course of business. In
accordance with GAAP standards for contingencies, in
evaluating these matters on an ongoing basis, we take into
account amounts already accrued on the balance sheet. In our
opinion, although the outcomes of these proceedings are
uncertain, they should not have a material adverse effect on
our financial position, results of operations or cash flows.
We have contractual obligations to purchase certain goods
or services from various other parties. Our purchase
obligations are expected to be approximately $2,890 in 2010,
$4,095 in total for 2011 and 2012, $2,549 in total for 2013
and 2014 and $694 in total for years thereafter.
See Note 9 for a discussion of collateral and credit-risk
contingencies.