AT&T Wireless 2009 Annual Report Download - page 42
Download and view the complete annual report
Please find page 42 of the 2009 AT&T Wireless annual report below. You can navigate through the pages in the report by either clicking on the pages listed below, or by using the keyword search tool below to find specific information within the annual report.-
 1
1 -
2
-
3
-
4
-
5
-
6
-
7
-
8
-
9
-
10
-
11
-
12
-
13
-
14
-
15
-
16
-
17
-
18
-
19
-
20
-
21
-
22
-
23
-
24
-
25
-
26
-
27
-
28
-
29
-
30
-
31
-
 32
32 -
 33
33 -
 34
34 -
 35
35 -
 36
36 -
 37
37 -
 38
38 -
 39
39 -
 40
40 -
 41
41 -
 42
42 -
 43
43 -
 44
44 -
 45
45 -
 46
46 -
 47
47 -
 48
48 -
 49
49 -
 50
50 -
 51
51 -
 52
52 -
53
-
54
-
55
-
56
-
57
-
58
-
59
-
60
-
61
-
62
-
63
-
64
-
65
-
66
-
67
-
68
-
69
-
70
-
71
-
72
-
73
-
74
-
75
-
76
-
77
-
78
-
79
-
80
-
81
-
82
-
83
-
84
-
85
-
86
-
87
-
88
-
89
-
90
-
91
-
92
-
93
-
94
-
95
-
96
-
97
-
98
-
99
-
100
 |
 |

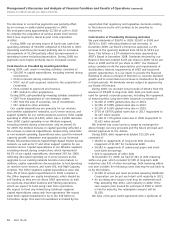
Management’s Discussion and Analysis of Financial Condition and Results of Operations (continued)
Dollars in millions except per share amounts
40 AT&T 09 AR
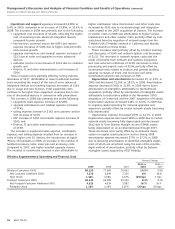
primarily related to lower revenues from operator services
and retail payphone operations.
Operating expenses decreased $308, or 10.3%, in 2009
and increased $946, or 46.4%, in 2008. The changes were
primarily due to charges of $550 and $978 associated with
our workforce reductions in 2009 and 2008 as a result of the
restructure of our operations from a collection of regional
companies to a single national approach.
Our Other segment operating results consist primarily of
Sterling, customer information services (primarily operator
services and payphone), corporate and other operations.
Sterling provides business-integration software and services.
Operating revenues decreased $311, or 15.2%, in 2009
and $187, or 8.4%, in 2008. The decrease in 2009 is primarily
due to reduced revenues from our operator services, retail
payphone operations and Sterling. The 2008 decline is
of $453 and lower sales agency revenue of approximately $113
due to the sale of the independent line of business segment of
the L.M. Berry Company. This decrease was partially offset by
increased Internet advertising revenue of $196.
Operating expenses decreased $216, or 5.7%, in 2009
largely driven by decreases in depreciation and amortization
expense of $140, product related costs of $74, advertising
costs of $44, and professional and contracted expense of $17.
These expense decreases were partially offset by an increase
in pension/OPEB and other benefit costs of $66. Operating
expenses decreased $203, or 5.1%, in 2008 largely driven by
decreased depreciation and amortization of $135 resulting
from use of an accelerated method of amortization for the
customer list acquired as part of the BellSouth acquisition,
and lower employee, professional and contract related
expenses. These expense decreases were partially offset by
increased YELLOWPAGES.COM, LLC (YPC) expansion costs.
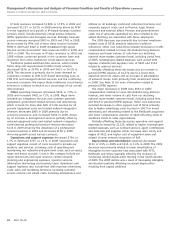
Operating Results
Our Advertising Solutions segment operating income margin
was 25.7% in 2009, 31.2% in 2008 and 31.8% in 2007.
The decrease in the segment operating income margin in
both 2009 and 2008 was primarily the result of decreased
operating revenues.
Operating revenues decreased $693, or 12.6%, in 2009
largely driven by continuing declines in print revenue of
$774 and lower sales agency revenue of $34 due to the sale
of the independent line of business segment of the L.M. Berry
Company. This decrease was partially offset by Internet
advertising revenue growth of $132. The ongoing economic
recession has reduced demand for advertising and customers
have continued to shift to Internet-based search services,
although the recession has also curbed search usage by
consumers. Operating revenues decreased $349, or 6%, in
2008 largely driven by continuing declines in print revenue
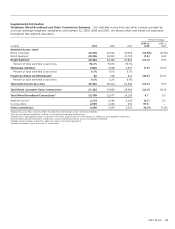
Other
Segment Results
Percent Change
2009 vs. 2008 vs.
2009 2008 2007 2008 2007
Total Segment Operating Revenues $1,731 $2,042 $2,229 (15.2)% (8.4)%
Total Segment Operating Expenses 2,678 2,986 2,040 (10.3) 46.4
Segment Operating Income (Loss) (947) (944) 189 (0.3) —
Equity in Net Income of Affiliates 706 794 645 (11.1) 23.1
Segment Income (Loss) $ (241) $ (150) $ 834 (60.7)% —
Advertising Solutions
Segment Results
Percent Change
2009 vs. 2008 vs.
2009 2008 2007 2008 2007
Total Segment Operating Revenues $4,809 $5,502 $5,851 (12.6)% (6.0)%
Segment operating expenses
Operations and support 2,922 2,998 3,066 (2.5) (2.2)
Depreciation and amortization 649 789 924 (17.7) (14.6)
Total Segment Operating Expenses 3,571 3,787 3,990 (5.7) (5.1)
Segment Income $1,238 $1,715 $1,861 (27.8)% (7.8)%