AT&T Wireless 2009 Annual Report Download - page 85
Download and view the complete annual report
Please find page 85 of the 2009 AT&T Wireless annual report below. You can navigate through the pages in the report by either clicking on the pages listed below, or by using the keyword search tool below to find specific information within the annual report.-
 1
1 -
2
-
3
-
4
-
5
-
6
-
7
-
8
-
9
-
10
-
11
-
12
-
13
-
14
-
15
-
16
-
17
-
18
-
19
-
20
-
21
-
22
-
23
-
24
-
25
-
26
-
27
-
28
-
29
-
30
-
31
-
32
-
33
-
34
-
35
-
36
-
37
-
38
-
39
-
40
-
41
-
42
-
43
-
44
-
45
-
46
-
47
-
48
-
49
-
50
-
51
-
52
-
53
-
54
-
55
-
56
-
57
-
58
-
59
-
60
-
61
-
62
-
63
-
64
-
65
-
66
-
67
-
68
-
69
-
70
-
71
-
72
-
73
-
74
-
 75
75 -
 76
76 -
 77
77 -
 78
78 -
 79
79 -
 80
80 -
 81
81 -
 82
82 -
 83
83 -
 84
84 -
 85
85 -
 86
86 -
 87
87 -
 88
88 -
 89
89 -
 90
90 -
 91
91 -
 92
92 -
 93
93 -
 94
94 -
 95
95 -
96
-
97
-
98
-
99
-
100
 |
 |

AT&T 09 AR 83
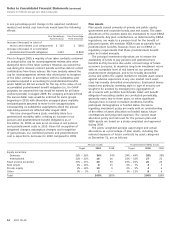
plans’ investments. Actual long-term return can, in relatively
stable markets, also serve as a factor in determining future
expectations. However, the dramatic adverse market
conditions in 2008 have skewed traditional measures of
long-term return, such as the 10-year return, which was 3.67%
through 2009 and 4.21% through 2008, compared with 9.18%
through 2007. The severity of the 2008 losses may make the
10-year return less of a relevant factor in future expectations.
In 2009, we experienced actual returns on investments much
greater than what was expected, which will create a reduction
in combined pension and postretirement costs for 2010.
Based on the future expectations for the target asset mix, this
assumption will remain unchanged for 2010. We consider
many factors that include, but are not limited to, historical
returns on plan assets, current market information on long-
term returns (e.g., long-term bond rates) and current and
target asset allocations between asset categories. The target
asset allocation is determined based on consultations with
external investment advisors. This assumption, which is based
on our long-term expectations of market returns in future
years, is one of the most significant of the weighted-average
assumptions used to determine our actuarial estimates of
pension and postretirement benefit expense. If all other
factors were to remain unchanged, we expect that a 1%
decrease in the expected long-term rate of return would
cause 2010 combined pension and postretirement cost to
increase $639.
Composite Rate of Compensation Increase Our expected
composite rate of compensation increase of 4% reflects the
long-term average rate of salary increases.
Health Care Cost Trend Our health care cost trend
assumptions are developed based on historical cost data, the
near-term outlook and an assessment of likely long-term
trends. In addition to the health care cost trend, we assume
an annual 3% growth in administrative expenses and an
annual 3% growth in dental claims. Due to benefit design
changes (e.g., increased co-pays and deductibles for
prescription drugs and certain medical services), we have
generally experienced better-than-expected claims cost in
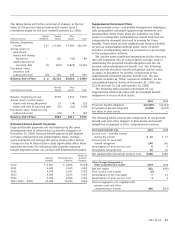
recent years. The following table provides our assumed
average health care cost trend based on the demographics
of plan participants:
2010 2009
Health care cost trend rate assumed
for current year
Retirees 64 and under 5.00% 5.21%
Retirees 65 and over 5.00% 5.36%
Rate to which the cost trend is assumed
to decline (the ultimate trend rate) 5.00% 5.00%
Year that rate reaches the
ultimate trend rate 2010 2010
Approximately 10% of pension and postretirement costs are
capitalized as part of construction labor, providing a small
reduction in the net expense recorded. Uncertainty in the
securities markets and U.S. economy could result in
investment returns less than those assumed. GAAP requires
that actual gains and losses on pension and postretirement
plan assets be recognized in the market-related value of
assets (MRVA) equally over a period of not more than five
years. We use a methodology, allowed under GAAP, under
which we hold the MRVA to within 20% of the actual fair
value of plan assets, which can have the effect of
accelerating the recognition of excess actual gains and
losses into the MRVA to less than five years. Due to
investment losses on plan assets experienced in 2008, this
methodology contributed approximately $1,577 to our
combined net pension and postretirement cost in 2009 as
compared with not using this methodology. This methodology
did not have a material impact on 2008 and 2007 combined
net pension and postretirement benefits. Should the
securities markets decline or medical and prescription drug
costs increase at a rate greater than assumed, we would
expect increasing annual combined net pension and
postretirement costs for the next several years. Should actual
experience differ from actuarial assumptions, the projected
pension benefit obligation and net pension cost and
accumulated postretirement benefit obligation and
postretirement benefit cost would be affected in future years.
Discount Rate Our assumed discount rate of 6.50% at
December 31, 2009, reflects the hypothetical rate at which
the projected benefit obligations could be effectively settled
or paid out to participants. We determined our discount rate
based on a range of factors, including a yield curve comprised
of the rates of return on several hundred high-quality, fixed-
income corporate bonds available at the measurement date
and the related expected duration for the obligations.
These bonds were all rated at least Aa3 or AA- by one
of the nationally recognized statistical rating organizations,
denominated in U.S. dollars, and neither callable, convertible
nor index linked. For the year ended December 31, 2009, we
decreased our discount rate by 0.50%, resulting in an increase
in our pension plan benefit obligation of $2,065 and an
increase in our postretirement benefit obligation of $1,847.
For the year ended December 31, 2008, we increased our
discount rate by 0.50%, resulting in a decrease in our pension
plan benefit obligation of $2,176 and a decrease in our
postretirement benefit obligation of $2,154.
Expected Long-Term Rate of Return Our expected
long-term rate of return on plan assets of 8.50% for 2010 and
2009 reflects the average rate of earnings expected on the
funds invested, or to be invested, to provide for the benefits
included in the projected benefit obligations. In setting the
long-term assumed rate of return, management considers
capital markets future expectations and the asset mix of the