AT&T Wireless 2009 Annual Report Download - page 83
Download and view the complete annual report
Please find page 83 of the 2009 AT&T Wireless annual report below. You can navigate through the pages in the report by either clicking on the pages listed below, or by using the keyword search tool below to find specific information within the annual report.-
 1
1 -
2
-
3
-
4
-
5
-
6
-
7
-
8
-
9
-
10
-
11
-
12
-
13
-
14
-
15
-
16
-
17
-
18
-
19
-
20
-
21
-
22
-
23
-
24
-
25
-
26
-
27
-
28
-
29
-
30
-
31
-
32
-
33
-
34
-
35
-
36
-
37
-
38
-
39
-
40
-
41
-
42
-
43
-
44
-
45
-
46
-
47
-
48
-
49
-
50
-
51
-
52
-
53
-
54
-
55
-
56
-
57
-
58
-
59
-
60
-
61
-
62
-
63
-
64
-
65
-
66
-
67
-
68
-
69
-
70
-
71
-
72
-
 73
73 -
 74
74 -
 75
75 -
 76
76 -
 77
77 -
 78
78 -
 79
79 -
 80
80 -
 81
81 -
 82
82 -
 83
83 -
 84
84 -
 85
85 -
 86
86 -
 87
87 -
 88
88 -
 89
89 -
 90
90 -
 91
91 -
 92
92 -
 93
93 -
94
-
95
-
96
-
97
-
98
-
99
-
100
 |
 |

AT&T 09 AR 81
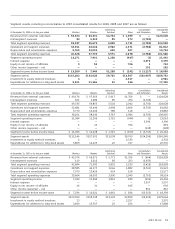
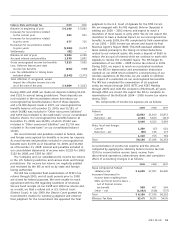
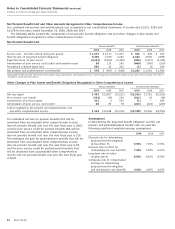
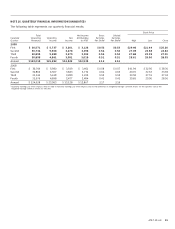
The following table presents this reconciliation and shows the change in the projected benefit obligation for the years ended
December 31:
Pension Benefits Postretirement Benefits
2009 2008 2009 2008
Benefit obligation at beginning of year $50,822 $53,522 $37,531 $40,385
Service cost – benefits earned during the period 1,070 1,173 334 429
Interest cost on projected benefit obligation 3,355 3,319 2,434 2,550
Amendments (685) (15) (3,115) (4)
Actuarial loss (gain) 2,439 (1,450) 1,402 (3,406)
Special termination benefits 118 70 9 5
Settlements — — — —
Benefits paid (6,269) (5,795) (2,370) (2,548)
Other — (2) — 120
Benefit obligation at end of year $50,850 $50,822 $36,225 $37,531
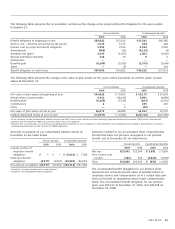
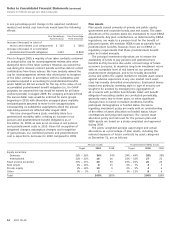
The following table presents the change in the value of plan assets for the years ended December 31 and the plans’ funded
status at December 31:
Pension Benefits Postretirement Benefits
2009 2008 2009 2008
Fair value of plan assets at beginning of year $46,828 $ 70,810 $ 10,175 $ 16,999
Actual return on plan assets 6,312 (18,190) 1,991 (4,688)
Benefits paid1 (6,269) (5,795) (823) (2,301)
Contributions 2 — 195 165
Other — 3 (25) —
Fair value of plan assets at end of year 46,873 46,828 11,513 10,175
Funded (unfunded) status at end of year2 $ (3,977) $ (3,994) $(24,712) $(27,356)
1 At our discretion, certain postretirement benefits are paid from AT&T cash accounts and do not reduce Voluntary Employee Beneficiary Association (VEBA) assets. Future benefit
payments may be made from VEBA trusts and thus reduce those asset balances.
2 Funded status is not indicative of our ability to pay ongoing pension benefits or of our obligation to fund retirement trusts. Required pension funding is determined in accordance
with Employee Retirement Income Security Act (ERISA) regulations.
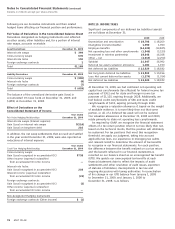
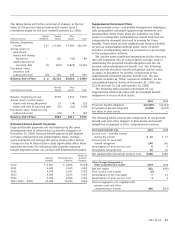
Amounts included in our accumulated other comprehensive
income that have not yet been recognized in net periodic
benefit cost at December 31 are listed below:
Pension Benefits Postretirement Benefits
2009 2008 2009 2008
Net loss $23,041 $23,004 $ 3,991 $ 3,695
Prior service cost
(credit) (181) 562 (4,644) (1,999)
Total $22,860 $23,566 $ (653) $ 1,696
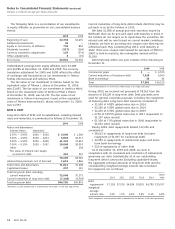
The accumulated benefit obligation for our pension plans
represents the actuarial present value of benefits based on
employee service and compensation as of a certain date and
does not include an assumption about future compensation
levels. The accumulated benefit obligation for our pension
plans was $49,122 at December 31, 2009, and $48,618 at
December 31, 2008.
Amounts recognized on our consolidated balance sheets at
December 31 are listed below:
Pension Benefits Postretirement Benefits
2009 2008 2009 2008
Current portion of
employee benefit
obligation1 $ — $ — $ (2,021) $ (729)
Employee benefit
obligation2 (3,977) (3,994) (22,691) (26,627)
Net amount recognized $(3,977) $(3,994) $(24,712) $(27,356)
1Included in “Accounts payable and accrued liabilities.”
2Included in “Postemployment benefit obligation.”