AT&T Wireless 2009 Annual Report Download - page 33
Download and view the complete annual report
Please find page 33 of the 2009 AT&T Wireless annual report below. You can navigate through the pages in the report by either clicking on the pages listed below, or by using the keyword search tool below to find specific information within the annual report.-
 1
1 -
2
-
3
-
4
-
5
-
6
-
7
-
8
-
9
-
10
-
11
-
12
-
13
-
14
-
15
-
16
-
17
-
18
-
19
-
20
-
21
-
22
-
 23
23 -
 24
24 -
 25
25 -
 26
26 -
 27
27 -
 28
28 -
 29
29 -
 30
30 -
 31
31 -
 32
32 -
 33
33 -
 34
34 -
 35
35 -
 36
36 -
 37
37 -
 38
38 -
 39
39 -
 40
40 -
 41
41 -
 42
42 -
 43
43 -
44
-
45
-
46
-
47
-
48
-
49
-
50
-
51
-
52
-
53
-
54
-
55
-
56
-
57
-
58
-
59
-
60
-
61
-
62
-
63
-
64
-
65
-
66
-
67
-
68
-
69
-
70
-
71
-
72
-
73
-
74
-
75
-
76
-
77
-
78
-
79
-
80
-
81
-
82
-
83
-
84
-
85
-
86
-
87
-
88
-
89
-
90
-
91
-
92
-
93
-
94
-
95
-
96
-
97
-
98
-
99
-
100
 |
 |

AT&T 09 AR 31
Management’s Discussion and Analysis of Financial Condition and Results of Operations
Dollars in millions except per share amounts
of Apple iPhone and an increase in wireline data revenue
largely due to Internet Protocol (IP) data growth, including
AT&T U-verseSM and broadband growth. Increases in 2008
reflect an increase in wireless subscribers and data revenues,
primarily related to IP data, partially offset by the continued
decline in voice revenues.
The declines in our wireline voice and advertising revenues
reflect continuing economic pressures on our customers as
well as competition. Total retail consumer voice connections
decreased 11.4% in 2009. Business customers also discon-
nected switched access lines, reduced usage-based services
and reduced print advertising. Customers disconnecting
access lines switched to wireless, Voice over Internet Protocol
(VoIP) and cable offerings for voice and data or terminated
service permanently as businesses closed or consumers left
residences. While we lose the voice revenues, we have the
opportunity to increase wireless service or wireline data
revenues should the customer choose us as their wireless or
VoIP provider. We also continue to expand our VoIP service
for customers who have access to our U-verse video service.
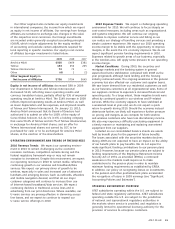
OV E RVIEW
Operating income decreased $1,571, or 6.8%, in 2009 and
increased $2,659, or 13.0%, in 2008. Our operating income
margin increased from 17.2% in 2007 to 18.6% in 2008 and
decreased to 17.5% in 2009. Operating income in 2009
decreased primarily due to the decline in voice revenues and
directory print advertising, an increase in pension and other
postemployment benefits (OPEB) expense, and the higher
cost of equipment sales in our Wireless segment attributed
to the continued success of Apple iPhone. These changes
were partially offset by lower employee-related costs due
to workforce reductions, along with the continued growth
in wireless service and wireline data revenue. In 2008,
operating income increased primarily due to continued
growth in wireless service and data revenues, along with a
decrease in the amortization of merger-related intangibles.
Operating revenues decreased $1,010, or 0.8%, in 2009
and increased $5,100, or 4.3%, in 2008. Revenues in 2009
reflect the continuing decline in voice revenues and a decline
in directory revenue driven by lower print revenue. These
declines were partially offset by continued growth in wireless
service revenue due to an increase in average number of
customers of 9.4%, driven in part by the continued success
For ease of reading, AT&T Inc. is referred to as “we,” “us,” “AT&T” or the “Company” throughout this document, and the names
of the particular subsidiaries and affiliates providing the services generally have been omitted. AT&T is a holding company
whose subsidiaries and affiliates operate in the communications services industry both in the United States and internationally,
providing wireless and wireline telecommunications services and equipment as well as directory advertising and publishing
services. You should read this discussion in conjunction with the consolidated financial statements and accompanying notes.
A reference to a “Note” in this section refers to the accompanying Notes to Consolidated Financial Statements. In the tables
throughout this section, percentage increases and decreases that equal or exceed 100% are not considered meaningful and
are denoted with a dash.
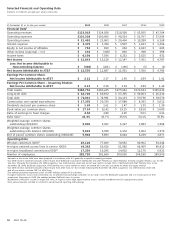
RESU LTS OF O PERATI O N S
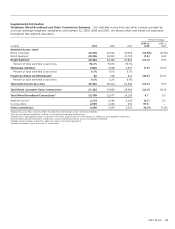
Consolidated Results Our financial results are summarized in the table below. We then discuss factors affecting our overall
results for the past three years. These factors are discussed in more detail in our “Segment Results” section. We also discuss our
expected revenue and expense trends for 2010 in the “Operating Environment and Trends of the Business” section.
Percent Change
2009 vs. 2008 vs.
2009 2008 2007 2008 2007
Operating Revenues $123,018 $124,028 $118,928 (0.8)% 4.3%
Operating expenses
Cost of services and sales 50,405 49,556 46,801 1.7 5.9
Selling, general and administrative 31,407 31,526 30,146 (0.4) 4.6
Depreciation and amortization 19,714 19,883 21,577 (0.8) (7.9)
Total Operating Expenses 101,526 100,965 98,524 0.6 2.5
Operating Income 21,492 23,063 20,404 (6.8) 13.0
Income Before Income Taxes 18,999 20,164 18,399 (5.8) 9.6
Net Income Attributable to AT&T 12,535 12,867 11,951 (2.6) 7.7
Diluted Earnings Per Share 2.12 2.16 1.94 (1.9)% 11.3%