AT&T Wireless 2009 Annual Report Download - page 73
Download and view the complete annual report
Please find page 73 of the 2009 AT&T Wireless annual report below. You can navigate through the pages in the report by either clicking on the pages listed below, or by using the keyword search tool below to find specific information within the annual report.-
 1
1 -
2
-
3
-
4
-
5
-
6
-
7
-
8
-
9
-
10
-
11
-
12
-
13
-
14
-
15
-
16
-
17
-
18
-
19
-
20
-
21
-
22
-
23
-
24
-
25
-
26
-
27
-
28
-
29
-
30
-
31
-
32
-
33
-
34
-
35
-
36
-
37
-
38
-
39
-
40
-
41
-
42
-
43
-
44
-
45
-
46
-
47
-
48
-
49
-
50
-
51
-
52
-
53
-
54
-
55
-
56
-
57
-
58
-
59
-
60
-
61
-
62
-
 63
63 -
 64
64 -
 65
65 -
 66
66 -
 67
67 -
 68
68 -
 69
69 -
 70
70 -
 71
71 -
 72
72 -
 73
73 -
 74
74 -
 75
75 -
 76
76 -
 77
77 -
 78
78 -
 79
79 -
 80
80 -
 81
81 -
 82
82 -
 83
83 -
84
-
85
-
86
-
87
-
88
-
89
-
90
-
91
-
92
-
93
-
94
-
95
-
96
-
97
-
98
-
99
-
100
 |
 |

AT&T 09 AR 71
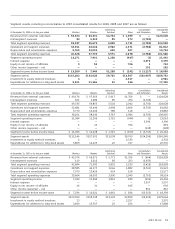
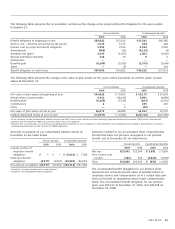
Segment results, including a reconciliation to AT&T consolidated results, for 2009, 2008 and 2007 are as follows:
Advertising Consolidation Consolidated
At December 31, 2009 or for the year ended Wireless Wireline Solutions Other and Elimination Results
Revenues from external customers $ 53,504 $ 63,331 $4,724 $ 1,459 $ — $123,018
Intersegment revenues 93 2,339 85 272 (2,789) —
Total segment operating revenues 53,597 65,670 4,809 1,731 (2,789) 123,018
Operations and support expenses 34,561 44,646 2,922 2,471 (2,788) 81,812
Depreciation and amortization expenses 5,765 13,093 649 207 — 19,714
Total segment operating expenses 40,326 57,739 3,571 2,678 (2,788) 101,526
Segment operating income 13,271 7,931 1,238 (947) (1) 21,492
Interest expense — — — — 3,379 3,379
Equity in net income of affiliates 9 18 — 706 1 734
Other income (expense) – net — — — — 152 152
Segment income before income taxes $ 13,280 $ 7,949 $1,238 $ (241) $ (3,227) $ 18,999
Segment assets $115,282 $163,028 $9,782 $13,567 $(32,907) $268,752
Investment in equity method investees 4 — — 2,917 — 2,921
Expenditures for additions to long-lived assets 5,921 11,166 22 226 — 17,335
Advertising Consolidation Consolidated
At December 31, 2008 or for the year ended Wireless Wireline Solutions Other and Elimination Results
Revenues from external customers $ 49,174 $ 67,669 $ 5,417 $1,768 $ — $124,028
Intersegment revenues 161 2,186 85 274 (2,706) —
Total segment operating revenues 49,335 69,855 5,502 2,042 (2,706) 124,028
Operations and support expenses 32,481 45,440 2,998 2,868 (2,705) 81,082
Depreciation and amortization expenses 5,770 13,206 789 118 — 19,883
Total segment operating expenses 38,251 58,646 3,787 2,986 (2,705) 100,965
Segment operating income 11,084 11,209 1,715 (944) (1) 23,063
Interest expense — — — — 3,390 3,390
Equity in net income of affiliates 6 19 — 794 — 819
Other income (expense) – net — — — — (328) (328)
Segment income before income taxes $ 11,090 $ 11,228 $ 1,715 $ (150) $ (3,719) $ 20,164
Segment assets $112,146 $157,501 $11,038 $8,769 $(24,209) $265,245
Investment in equity method investees 2 — — 2,330 — 2,332
Expenditures for additions to long-lived assets 5,869 14,129 20 317 — 20,335
Advertising Consolidation Consolidated
At December 31, 2007 or for the year ended Wireless Wireline Solutions Other and Elimination Results
Revenues from external customers $ 42,574 $ 69,571 $ 5,771 $1,976 $ (964) $118,928
Intersegment revenues 110 2,012 80 253 (2,455) —
Total segment operating revenues 42,684 71,583 5,851 2,229 (3,419) 118,928
Operations and support expenses 28,585 46,177 3,066 1,882 (2,763) 76,947
Depreciation and amortization expenses 7,079 13,416 924 158 — 21,577
Total segment operating expenses 35,664 59,593 3,990 2,040 (2,763) 98,524
Segment operating income 7,020 11,990 1,861 189 (656) 20,404
Interest expense — — — — 3,507 3,507
Equity in net income of affiliates 16 31 — 645 — 692
Other income (expense) – net — — — — 810 810
Segment income before income taxes $ 7,036 $ 12,021 $ 1,861 $ 834 $(3,353) $ 18,399
Segment assets $103,559 $158,338 $13,103 $2,859 $(2,215) $275,644
Investment in equity method investees 13 — — 2,257 — 2,270
Expenditures for additions to long-lived assets 3,840 13,767 25 256 — 17,888